
TLDR
Construction cost benchmarking is the practice of comparing a project’s estimated, bid, or actual cost against normalized reference data from similar projects, cost databases, supplier quotes, or market indexes. The benchmark number itself matters less than whether it has been adjusted for scope, location, timing, and market conditions. Contractors who treat benchmarks as directional tools (not hard prices) and combine them with internal job-cost history and current vendor quotes make better purchasing and estimating decisions.
Construction Cost Benchmarking: Quick Takeaway
Construction cost benchmarking is the process of comparing your project’s estimated costs against normalized historical data to ensure market alignment. In 2026, the most effective benchmarks are internal job-cost history and localized market indexes.
Key Benchmark Metrics for 2026:
Industrial/Warehouse: $100 – $180 per SF (Core & Shell)
Healthcare/Life Sciences: $200 – $1,000+ per SF
Data Centers: $600 – $1,200+ per SF
Ready-Mix Concrete: $160 – $195+ per CY
Asphalt Paving: $4.00 – $10.00 per SF
What Is Construction Cost Benchmarking?
Construction cost benchmarking means comparing a project’s cost against reliable reference points. Those reference points might come from completed projects, published cost databases like RSMeans or Gordian, government bid tabs, supplier quotes, industry reports, or a contractor’s own job-cost history.
Benchmarks are typically expressed in standardized units: cost per square foot, cost per cubic yard, cost per ton, cost per linear foot, cost per parking stall, cost per dock position, or cost as a percentage of total project value. The format depends on the trade, the project phase, and who needs the information.
Here is the critical distinction: a benchmark answers the question, “Is this cost reasonable for this scope, in this location, at this point in time, under these market conditions?” A weak benchmark only answers, “What did something cost somewhere else?”
RICS guidance on cost analysis and benchmarking confirms that benchmark data can inform design development, cost planning, and project risk, but only when the data comes from comparable projects and is properly analyzed for location and price basis. Source
Think of it like a comp in real estate. A 100,000-square-foot warehouse shell, a cold-storage facility, and a fully built-out manufacturing plant may all be “industrial,” but they are not the same benchmark. The comparison only works when the underlying scope matches.
Why Construction Cost Benchmarks Matter
Contractors, owners, and procurement teams use construction cost benchmarking for overlapping but distinct reasons.
Budget validation before design is complete. Early-stage benchmarks support feasibility studies, funding decisions, and go/no-go calls before detailed takeoffs exist. AACE’s estimate classification matrix shows that Class 5 concept-level estimates may rely on square-foot factoring or parametric models, while mature Class 1 and 2 estimates require detailed takeoff and unit costs. Source
Bid and proposal pressure-testing. A benchmark can flag outlier bids before a contractor accepts a risky price or an owner rejects a fair one.
Procurement decisions. Contractors can compare supplier quotes, national pricing programs, historical purchase prices, and market indexes to determine whether a vendor’s number is competitive.
Value engineering. Element-level benchmarks reveal whether cost pressure is coming from structure, sitework, MEP, finishes, paving, logistics, labor productivity, or overhead.
Institutional memory. The most valuable benchmark database is often a contractor’s own completed-job data, tagged by scope, location, schedule, crew mix, quantities, vendors, and production rates. Practitioners on Reddit describe building systems where estimates, bids, GMPs, and project metadata are uploaded so teams can search comparable projects and update historical costs with city and time indexes. Source
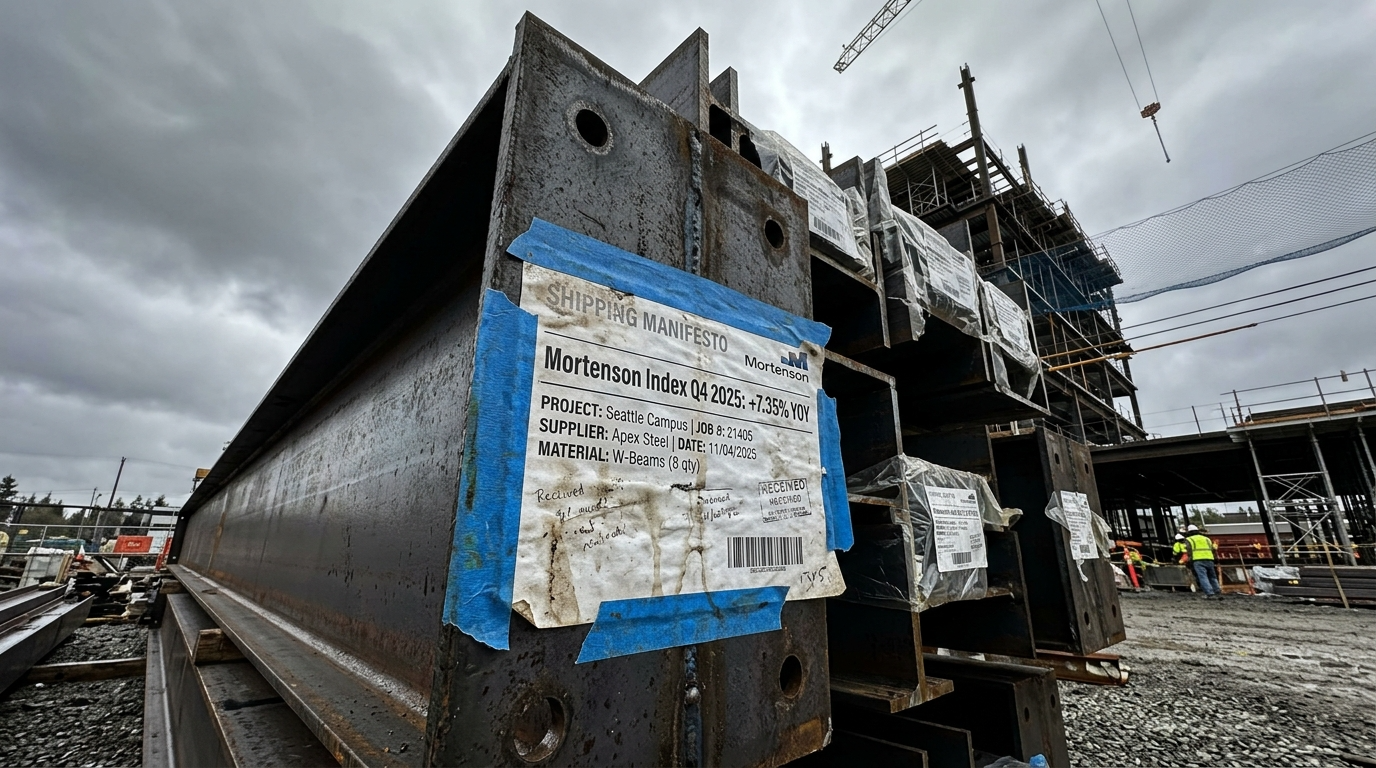
Market drift identification. Benchmarks help teams see when unit prices are moving faster than budgets, contract allowances, or outdated price books. Mortenson’s Q4 2025 Construction Cost Index reported its national index up 7.35% year over year, driven by elevated metal costs, embedded tariffs, and persistent electrical and power-distribution lead times. Source
For contractors focused on construction purchasing strategy best practices, benchmarking provides the factual foundation for negotiating better vendor terms.
Construction Cost Benchmarking vs. Estimating vs. Budgeting
These terms get confused constantly, and the confusion causes real problems.
Term | What it does | Output | Risk if confused |
|---|---|---|---|
Benchmarking | Compares costs against normalized reference data | Range, ratio, index, or sanity check | Treating a reference number as a project-specific price |
Estimating | Calculates expected project cost from scope, quantities, productivity, labor, materials, equipment, subs, overhead, and profit | Project estimate | Missing project-specific conditions if relying only on benchmarks |
Budgeting | Sets the funding plan or cost limit for a project | Approved budget | Setting a budget on stale or incomplete benchmarks |
Bidding | Submits a price to perform defined work under contract terms | Bid or proposal | Underpricing work if benchmarks replace real quotes and takeoff |
Cost control | Tracks actual cost against budget during execution | Variance reports, forecast at completion | Benchmarking too late to influence procurement or scope |
A benchmark can tell you whether a number looks reasonable. It cannot tell you whether your exact scope is fully priced.
Common Types of Construction Cost Benchmarks
Not all benchmarks carry equal weight. The source, format, and freshness of the data determine how much trust it deserves.
Internal Historical Benchmarks
Completed jobs, invoices, purchase orders, labor hours, production rates, and cost-code history. This is often the strongest data a contractor has, because it reflects actual conditions, actual crews, and actual vendor pricing.
One quantity surveying practitioner on Reddit summarized real estimating pricing as a combination of historical rates and tendering packages, noting that no tool (including AI) changes the need for proper pricing discipline. Source
Published Cost Databases
RSMeans/Gordian is the most widely known. The Gordian City Cost Index compares the cost of a standardized construction project in a specific location against a national average derived from 30 major U.S. cities, accounting for 66 materials, 21 trades, and six pieces of equipment plus fuel and maintenance. Source
Practitioners on Reddit report mixed experiences. In one thread, a Denver GC said RSMeans pricing ran about 30% low for school contracts in their market, while another commenter defended RSMeans as a widely accepted, localized data source for public entities, JOC, and military work. Source The practical takeaway: national databases are useful for early validation and structured comparison, but they need local calibration.
Market Indexes
BLS Producer Price Index series, ENR indexes, Mortenson’s quarterly cost index, and historical cost indexes. These track relative cost movement over time or across locations. BLS March 2026 PPI data showed materials and components for construction up 3.3% year over year, while nonresidential construction input prices were 5.4% higher year over year per ABC’s analysis. Source
Ed Zarenski’s construction inflation analysis warns that input-cost indexes do not fully capture final cost to the owner because they may omit labor, productivity, margins, overhead, and profit. He recommends actual final-cost or selling-price indexes when adjusting total project cost over time. Source
Bid-Tab and Agency Benchmarks
DOT average bid prices, public owner bid tabs, and highway material forecasts. FDOT’s 2024/2025 Q2 SRES report, for instance, forecasts Florida hot-mix asphalt at $176/ton in 2026 and aggregate base at $34/SY. Source These figures are strong for heavy civil comparison but should not be applied blindly to private commercial paving, where scope, mobilization, specifications, and bid environment differ.
Supplier and Subcontractor Quote Benchmarks
Current vendor pricing, recurring material quotes, and equipment costs. For high-volatility or long-lead items, real supplier quotes should outrank generic benchmark data every time.
A practitioner in an MEP engineering thread on Reddit described vendor quotes for major equipment coming in 2 to 5 times higher than RSMeans material costs for similar descriptions. Commenters recommended maintaining a spreadsheet of bid and contracted equipment costs and escalating based on actual recent job data. Source
Industry Association Benchmarks
NRMCA’s Annual Performance Benchmarking Survey provides ready-mix volume trends, selling price per cubic yard, delivery cost, and profitability benchmarks. Their 2023 participant data showed an average total selling price of $159.68 per cubic yard, with bottom-quartile profitability participants at $150.03/CY and top-quartile at $170.66/CY. Source
How to Normalize a Construction Cost Benchmark
This is where most published benchmark content falls short. Giving a number without teaching normalization is like giving a recipe without temperatures.
The Seven Adjustments
Before trusting any benchmark, run it through these filters:
1. Scope adjustment. Are you comparing the same building type, element, system, or work package? Shell-only numbers cannot be compared to turnkey costs. Material-only cannot be compared to installed.
2. Quantity adjustment. Is the unit basis the same? Gross SF, net SF, paved SF, CY, ton, LF, or capacity metric? Scale matters too. A 10,000-SF concrete pour has different unit economics than a 200,000-SF pour.
3. Location adjustment. Same labor market, freight costs, and material availability? A LinkedIn practitioner argued that location-factor multipliers can introduce errors because they may not capture granular local variation in specific trades, materials, or equipment. Source Location factors are helpful, but local quotes and recent bid results are stronger.
4. Time adjustment. Same bid date or midpoint of construction? A benchmark from even two years ago can be misleading without escalation. AGC’s March 2026 analysis reported aluminum mill shapes up 39.1%, steel mill products up 20.9%, and fabricated structural metal up 20.0% year over year. Source Those swings can render a 2024 steel benchmark useless in 2026.
5. Cost-basis adjustment. Hard cost, soft cost, total development cost, or material-only? Turner & Townsend’s Las Vegas construction cost benchmarking tables define their figures as direct hard construction costs per square foot, explicitly excluding design fees, permits, insurance, FF&E, and owner contingencies. Source Many benchmark misunderstandings trace back to this single issue.
6. Market adjustment. Supplier capacity, bid competition, volatility, and lead times all shift costs. ABC’s 2026 workforce shortage model estimated the industry needs 349,000 net new workers to meet demand, which affects labor availability, schedule risk, and wage pressure. Source
7. Risk adjustment. Is contingency included? Whose contingency: owner, contractor, estimator, or design? What about escalation allowances, site conditions, and schedule pressure?
RICS recommends testing pricing sensitivity with different scenarios and adjusting or removing project-specific abnormal costs that would distort comparison. Source
Pro Tip: The 2026 Escalation Gap
Many 2024-2025 benchmarks are now obsolete due to the “2026 Escalation Gap.” With metals and electrical components seeing 20%+ year-over-year increases, any benchmark older than six months should be escalated using a compounded monthly rate of 0.4% to 0.7% to maintain accuracy in your 2026 estimates.
The Conceptual Formula
Think of normalization this way:
Adjusted benchmark = historical cost × (current index / original index) × (target location factor / source location factor) + scope deltas + site-condition deltas + procurement/labor/risk allowances
This is not a rigid calculation. It is a framework for making sure you are comparing like to like.
Examples: Concrete, Asphalt, and Building Cost Benchmarks
Why Two Concrete Benchmarks Disagree
A contractor gathering concrete cost data might encounter three numbers:
Ready-mix concrete: $160 to $195+ per cubic yard nationwide. Source
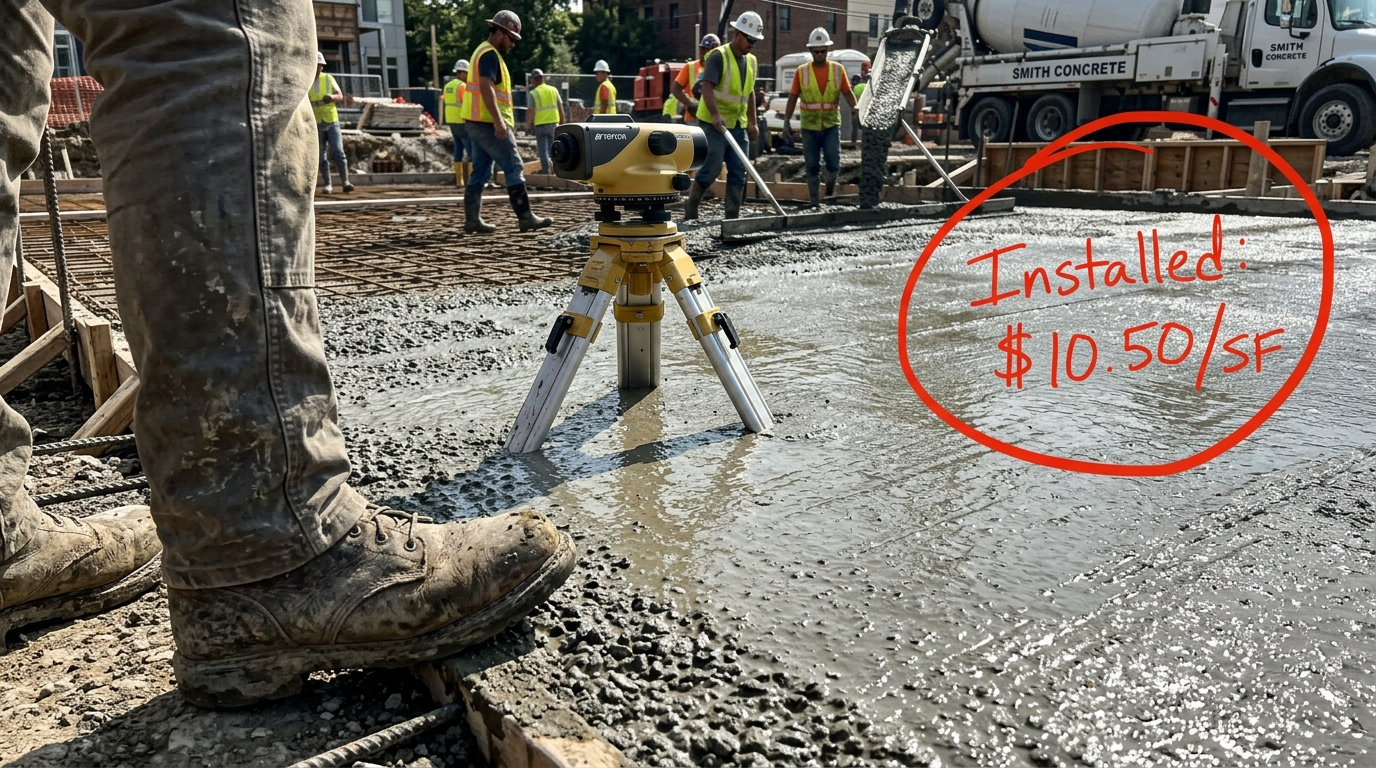
Plain concrete slab, installed: $6.50 to $10.50 per square foot. Source
Commercial concrete slab: $6 to $12/SF basic, or $10 to $15+/SF for reinforced or structural slabs. Source
These numbers are not conflicting. They are answering different questions.
The $/CY figure is material volume, covering the ready-mix itself. The $/SF installed figure includes labor, forms, reinforcement, subbase preparation, placement, finishing, equipment, overhead, and profit. The reinforced slab range reflects different thickness, rebar specifications, load requirements, finishing tolerance, and placement complexity.
If one benchmark is material-only and the other is installed work, comparing them directly is meaningless. The unit and scope basis must match.
Asphalt Paving Benchmark
A property owner or contractor evaluating a commercial asphalt quote can reference a 2026 benchmark range of $4.00 to $10.00 per square foot for new asphalt installation. Source But that range is wide for a reason.
Where a project falls inside the range depends on milling requirements, surface preparation, base remediation, drainage work, asphalt thickness, truck-traffic loads, striping, ADA compliance, mobilization distance, phasing, and whether work happens at night or on weekends. FDOT’s HMA forecast of $176/ton is useful for heavy civil comparison, but DOT pay-item prices reflect a public bid environment with different specifications, traffic control requirements, and project sizes than a private commercial parking lot.
Commercial Building Benchmarks
Terrapin’s 2026 commercial cost guide gives broad U.S. ranges: dry warehouses at $55 to $175/SF, cold storage at $130 to $350+/SF, healthcare at $200 to $1,000+/SF, and data centers at $600 to $1,200+/SF. Source Turner & Townsend lists industrial warehouse core-and-shell construction in Las Vegas at $100/SF low, $140/SF medium, and $180/SF high for 100,000+ SF buildings. Source
The spread between the low and high end of any building-type range is enormous. The scope definition explains where a project lands inside that range.
2026 Construction Cost Reference Table (National Averages)
The following table summarizes current cost benchmarks by category. Use these for early-stage feasibility, but ensure you apply Normalization Factors (Location, Time, and Scope) before finalizing budgets.
Category | Unit of Measure | 2026 Benchmark Range | Primary Cost Drivers |
Concrete (Material) | Cubic Yard (CY) | $160 – $195 | Fuel surcharges, aggregate availability |
Asphalt (Installed) | Square Foot (SF) | $4.00 – $10.00 | Petroleum prices, mobilization distance |
Warehouse (Dry) | Square Foot (SF) | $55 – $175 | Clear height, slab thickness, dock count |
Cold Storage | Square Foot (SF) | $130 – $350 | Insulation R-value, refrigeration MEP |
Data Centers | Square Foot (SF) | $600 – $1,200 | Power density, cooling redundancy |
Structural Steel | Ton | $3,500 – $4,500 | Tariffs, mill lead times, fabrication labor |
Best Data Sources for Benchmarking Construction Costs
Source | Best for | Watch out for |
|---|---|---|
Internal job-cost data | Contractor-specific pricing and productivity | Needs clean cost codes and context |
Supplier quotes | Current materials and equipment pricing | Quote expiration, freight, lead times |
Subcontractor bids | Real market pricing | Scope gaps, exclusions, market competition |
RSMeans/Gordian | Structured unit costs, city factors, early estimates | Must calibrate locally; can lag hot markets |
BLS PPI | Material and input trends, escalation | May not equal final installed cost |
ENR/Mortenson indexes | Trend tracking and market summaries | Index basket may not match your project |
DOT bid tabs | Heavy civil and public work | Public bid environment differs from private work |
Trade associations (NRMCA, etc.) | Industry-specific benchmarks | Survey definitions and participation pools matter |
For contractors looking to improve how they compare vendor pricing across projects and regions, a construction sourcing strategy built on clean benchmark data creates a much stronger negotiating position.
Common Construction Cost Benchmarking Mistakes
Using old benchmarks without escalation. Construction input prices can shift dramatically in a single year. ABC reported nonresidential construction input prices 5.4% higher year over year in March 2026. Source A 2023 benchmark applied in 2026 without adjustment will mislead.
Comparing different scopes. Hard cost versus total development cost. Shell versus turnkey. Material-only versus installed. These are different measurements of different things.
Ignoring local labor and vendor capacity. National averages flatten out the very market conditions that drive actual cost. A LinkedIn cost engineering practitioner wrote that U.S. historical data was a poor primary estimating basis for a project in Mexico because of different labor productivity, market conditions, regulations, and execution methods. Source The same principle applies between U.S. cities.
Using material-only benchmarks for installed work. A ready-mix benchmark of $180/CY tells you nothing about what the finished slab will cost per square foot.
Using national averages for specialty trades or long-lead equipment. MEP equipment, electrical switchgear, and specialized systems are areas where published data is most likely to be wrong. Current vendor quotes win.
Forgetting the “invisible” costs. Mobilization, phasing, operational downtime, traffic control, testing, permits, and cleanup often fall outside benchmark ranges but show up in real bids.
Treating the lowest benchmark as best value. RICS warns that the lowest-cost benchmark may not represent best value without considering distribution of cost, specification quality, circulation, and other design factors. Source
Sharing competitor-sensitive pricing data without safeguards. NRMCA’s antitrust statement warns that competitors should avoid discussing prices, pricing policies, individual company costs, territories, or other competitively sensitive subjects. Source Construction cost benchmarking between firms should use aggregated, anonymized data.
How Contractors Can Build Better Cost Benchmarks
The contractors who get the most out of benchmarking are the ones who build their own data over time.
What to Track
For each completed project, capture:
Project type, region, and owner type
Contract type and delivery method
Bid date and construction midpoint
Cost codes with actual costs
Major quantities
Material vendors and subcontractors
Unit costs (bid, buyout, and final)
Labor hours, crew sizes, and production rates
Equipment used
Mobilization distance
Schedule constraints and change orders
Final margin
Lessons learned and abnormal conditions
The Process
Standardize cost codes and units across projects.
Capture bid, buyout, and final cost separately. The gap between bid price and buyout price is procurement intelligence.
Record supplier quotes with expiration dates.
Tag abnormal conditions so they do not distort future comparisons.
Update historical costs using indexes, then validate with current quotes.
Review outliers during closeout.
Use benchmarks for early pricing, buyout strategy, and vendor negotiations.
Contractors who pair benchmark data with purchasing leverage strategies can turn cost intelligence into real savings on recurring materials and vendor programs.
A LinkedIn post about soil procurement described a centralized quote hub allowing GCs to see what they paid for select fill or topsoil by region in the prior quarter and benchmark new proposals against market averages. Source That kind of procurement-specific benchmarking is where the practice creates the most direct value for contractors.
What a Good Benchmark Report Should Include
Any benchmark you share internally or with a client should state:
Data source and number of comparable projects or quotes
Base date and location
Cost basis (hard, soft, total, material-only, installed)
Inclusions and exclusions
Unit of measure and project size range
Labor and material assumptions
Index used for escalation and location factor applied
Outliers removed or adjusted
Range, median, and mean (if enough data exists)
A clear statement that it is not a guaranteed price
RICS recommends keeping benchmark presentations simple, separating detailed data from summary charts, maintaining confidentiality, and using consistent project references. Source
Connecting Benchmarks to Purchasing Decisions
Construction cost benchmarking should not stop at project budgets. The same discipline applies to supplier quotes, recurring material purchases, equipment rentals, freight rates, vendor rebates, and national programs.
When a contractor knows that ready-mix concrete ran $165/CY on their last three Southeast projects, and a new supplier quotes $185/CY for comparable specs and delivery, that gap demands a conversation. Maybe the market moved. Maybe the supplier is pricing in risk. Maybe there is a volume discount available. The benchmark creates the starting point for that negotiation.
Over time, this turns benchmarking from a one-time estimating exercise into a purchasing advantage. Contractors who combine benchmark data with contractor vendor partnerships and group purchasing power are better positioned to hold margins even as material costs shift.
FAQ
Is construction cost benchmarking the same as estimating?
No. Benchmarking compares a cost against reference data. Estimating builds a project cost from scope, quantities, labor, materials, equipment, subcontractors, overhead, profit, and risk. AACE’s classification system shows early estimates may use parametric or square-foot methods, while mature bid estimates require detailed takeoff and unit costs. Benchmarks can inform estimates, but they cannot replace them.
What is a construction cost index?
A construction cost index tracks relative cost movement over time or across locations. Examples include RSMeans Historical Cost Index, Gordian City Cost Index, BLS PPI series, ENR indexes, and Mortenson’s quarterly index. Gordian’s CCI compares a standardized project’s cost in a specific city against a 30-city national average. Source
What is the best construction cost benchmark?
The best benchmark is usually the most recent, local, scope-matched, and verifiable data available. For contractors, internal completed-job data and current supplier quotes typically beat generic national averages. Published indexes and cost databases are useful for calibration and trend tracking, but they should be a starting layer, not the final word.
Can benchmarks be used for hard bids?
Only as a check. Hard bids require detailed scope review, quantity takeoff, current quotes, labor planning, risk review, contract terms, and overhead/profit decisions. Practitioners on Reddit report that cost books like RSMeans can land “middle of the pack” compared with actual bids, and teams often create their own locality coefficients to get closer to real pricing. Source
Why do construction cost benchmarks vary so much?
Benchmarks vary because they may reflect different locations, dates, cost bases, project scopes, units, labor assumptions, delivery methods, market conditions, and inclusions/exclusions. Two numbers that look contradictory are often just answering different questions. RICS emphasizes that benchmark data must share the same location and price basis to be comparable. Source
How often should construction cost benchmarks be updated?
At minimum, quarterly for active materials and trades, and before any new bid or budget cycle. In volatile markets (metals, fuel-sensitive materials, long-lead electrical equipment), monthly or even per-project validation against current supplier quotes is safer. Mortenson publishes its cost index quarterly; BLS PPI data is released monthly.
Should contractors share benchmark data with competitors?
Only with proper safeguards. NRMCA includes antitrust language warning against competitor discussions of prices, pricing policies, individual company costs, or territories. Benchmarking between firms should use aggregated, anonymized data, and any shared benchmarking effort should have legal review.
How does construction cost benchmarking help with procurement?
Benchmarking gives procurement teams a factual basis for comparing supplier quotes, identifying cost drift in recurring materials, negotiating volume discounts, and evaluating whether a construction buying group or national pricing program is delivering real value. Without benchmarks, procurement decisions rely on gut feel or vendor claims.

Recent Comments