
TL;DR
Commercial contractors operate on razor-thin 4 to 6% net margins, meaning a single cost overrun can wipe out an entire project’s profit. This guide covers 10 field-tested contractor cost control strategies, each backed by industry data, that address everything from preconstruction estimating to purchasing power and preventive maintenance. The biggest untapped opportunity for most contractors is pooling purchasing volume through buying groups, which can cut material costs by 8 to 15%.
At a Glance: How to Control Contractor Costs in 2026
To maintain a 4–6% net margin in the current market, contractors must move from reactive accounting to proactive cost management. The most effective cost control strategies include:
Aggressive Preconstruction: Solving 70% of budget failures before kickoff.
Real-Time Labor Tracking: Reducing the 35% of time wasted on non-productive field activities.
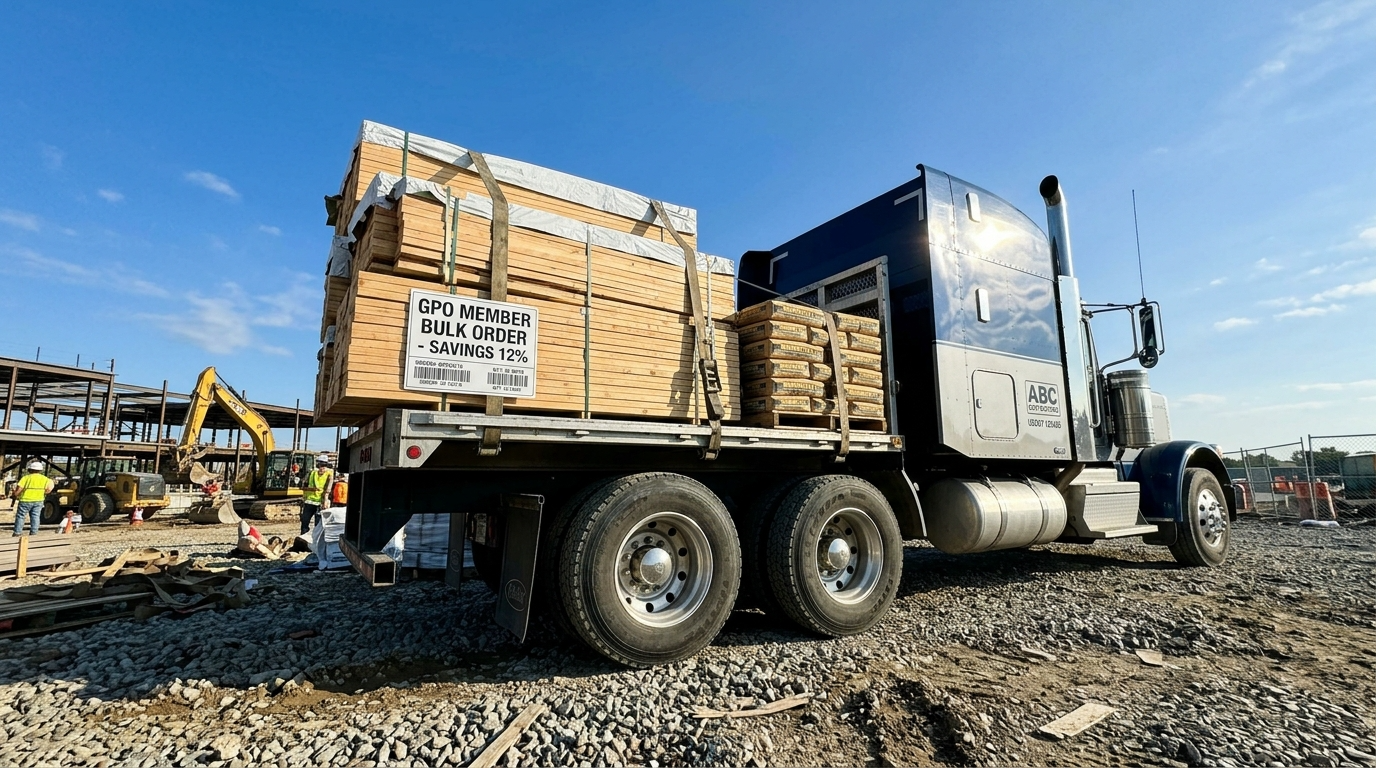
Consolidated Sourcing: Joining Group Purchasing Organizations (GPOs) to secure 8–15% discounts on materials.
Lifecycle Maintenance: Avoiding the “deferral tax” where every $1 of skipped maintenance becomes $3–$7 in future repairs.
The Margin Problem Every Contractor Faces
Here’s the math that should keep every contractor up at night: commercial construction net profit margins average 4% to 6%. On a $2 million project, that’s $80,000 to $120,000 in profit. A 10% cost overrun, just $200,000, doesn’t just eat your margin. It puts you in the red.
And overruns are not rare. They’re the norm. Across 20 countries and 70 years of data, 85% of construction projects experienced cost overruns, averaging 28%. According to KPMG’s Global Construction Survey, only 25% of projects finish within 10% of their original budget.
These numbers are not abstract. They represent real contractors losing real money on real jobs. The challenges facing the construction industry today, from material price volatility to labor shortages, make effective contractor cost control more important than it has been in decades.
The 10 strategies below aren’t theoretical. Each one targets a specific cost category, comes with supporting data, and c
n be implemented on your next project.
The 2026 Economic Climate: Why Traditional Controls Aren’t Enough
In 2026, contractor margins are being squeezed by three specific factors that require the updated strategies mentioned in this guide:
Market Driver | Impact on Budget | 2026 Outlook |
Labor Scarcity | Increases wages by 4-7% annually | High: Demand for skilled trades exceeds supply by 22%. |
Material Volatility | Causes 10-15% “estimate drift” | Moderate: Supply chains have stabilized, but pricing remains “sticky.” |
Regulatory Compliance | Adds 2-3% in reporting overhead | High: New green building and safety reporting mandates are now standard. |
Cost Control Strategies: At-a-Glance Comparison
Strategy | Primary Cost Category | Estimated Impact | Difficulty | Best For |
|---|---|---|---|---|
Accurate Preconstruction Estimates | All categories | Prevents 70% of overrun causes | Medium | Project managers, estimators |
Monthly Budget Forecasting | All categories | Catches 5-10% drift early | Low | Project managers, superintendents |
Real-Time Labor Tracking | Labor (20-40% of costs) | 15-25% better margins | Medium | Field supervisors, payroll |
Scope Creep Management | Change orders | Prevents 27% average overrun | Medium | PMs, contract administrators |
QA/QC and Rework Reduction | Quality costs (5-10%) | 25-28% more likely to hit margin targets | Medium | Quality managers, field teams |
Purchasing Groups and Vendor Partnerships | Materials (40-60% of costs) | 8-15% material savings | Low | Owners, procurement teams |
Multi-Trade Consolidation | Labor and coordination | 12-18% labor cost reduction | Low | Property owners, GCs |
Technology for Cost Visibility | All categories | 61% report fewer errors | High | Tech-ready firms |
Preventive Maintenance Programs | Long-term facility costs | 545% ROI over 25 years | Medium | Property owners, facility managers |
Post-Project Audits | Future project accuracy | Measurable gains in 2-3 projects | Low | Estimators, executives |
1. Lock Down Accurate Estimates During Preconstruction
Best for: Preventing the single most common cause of budget failure before a shovel hits dirt.
Inaccurate initial estimates contribute to overruns in approximately 70% of projects. That makes estimating the most important cost control decision you’ll make on any job.
How to implement:
Pull historical cost data from at least three similar completed projects. Adjust for current material pricing, local labor rates, and site conditions.
Include your operations team (superintendents, foremen) in the estimating process. They catch field-level costs that estimators working from plans alone will miss, like difficult access, staging limitations, or soil conditions.
Review the contract structure line by line for hidden cost allocations. Corporate staff charges, insurance requirements, and warranty provisions can add 3 to 5% that never appeared in the original estimate.
Build contingency into each major cost category rather than adding a single lump-sum contingency at the bottom. A 5% contingency on concrete and a 10% contingency on site work is more useful than 7% across the board.
Common mistake: Estimating based on the project you want rather than the project you have. Optimism bias is real. If your last three similar jobs came in 8% over estimate, your next estimate should reflect that pattern, not ignore it.
Contractors who track actual costs against estimates in real-time achieve 15 to 25% better margins than those who wait until project completion to compare numbers.
2. Run Monthly Budget Forecasts, Not Quarterly
Best for: Catching small cost overruns before they compound into project-killing losses.
Quarterly budget reviews are too slow. A 3% overage in temporary facilities, equipment rental, or dumpster costs can run for eight weeks before anyone notices. Monthly forecasting forces a line-by-line review of every budget category against actual spending.
How to implement:
Schedule a mandatory monthly forecast meeting with the project manager, superintendent, and accounting. The superintendent matters because they make daily cost decisions in the field.
Compare committed costs (contracts signed, POs issued) against original budget, not just invoices received. Money you owe but haven’t been billed for yet is still money spent.
Flag any category running more than 5% over forecast and require a corrective action plan before the next review.
Common mistake: Treating the forecast as a reporting exercise rather than a decision-making tool. If the forecast shows concrete is trending 12% over budget, the meeting should end with three specific actions to address it, not just a note in the minutes.
Having a solid construction purchasing strategy in place before the project starts makes these monthly reviews far more productive, because you have benchmarks to measure against.
3. Track Labor Costs in Real Time
Best for: Controlling the highest-risk, most variable cost category on any construction project.
Labor typically represents 20 to 40% of total project costs, and it’s the category most likely to surprise you. Research suggests that 35% of construction professionals’ time goes to non-productive activities like waiting for materials, rework, and travel between work areas.
How to implement:
Implement mobile time-tracking that captures hours by cost code, not just by employee. Knowing your crew worked 400 hours last week is useless if you can’t tell which tasks consumed those hours.
Compare actual labor hours against estimated hours weekly, not monthly. If framing was estimated at 320 hours and you’ve burned 280 hours at 60% completion, you have a problem now, not in four weeks.
Track overtime separately and require superintendent approval for any overtime beyond 5% of weekly planned hours.
Common mistake: Relying on handwritten timesheets submitted days after the work was performed. Memory fades, rounding happens, and payroll disputes follow. Digital time-tracking catches deviations when they’re at 5%, not 25%.
Pro Tip from the Field: > “The biggest leak in any labor budget isn’t the hourly rate; it’s the ‘wind-down’ time. If your crews spend 45 minutes at the end of the day cleaning up without a standardized process, you’re losing nearly 10% of your labor budget to non-productive time.”
4. Manage Subcontractors and Scope Creep Aggressively
Best for: Preventing the budget erosion that happens through uncontrolled change orders and vague scopes.
75% of construction projects experience scope creep. Projects that suffer from it see an average cost overrun of 27%. Scope creep affects 52% of all projects, making it the second most common cause of budget failure after bad estimates.
How to implement:
Get more subcontractor bids (aim for five, not three) and level them rigorously. Ensure every bidder is pricing the same scope with the same inclusions and exclusions.
Lock fixed pricing early. The longer you wait to finalize subcontract values, the more exposure you carry to price increases.
Establish a formal change order review process. No change order gets approved without a documented cost impact, schedule impact, and sign-off from the project manager and owner.
Track all open change orders weekly in a shared log visible to all parties. Surprises kill budgets.
Common mistake: Approving small change orders without scrutiny. Twenty $5,000 change orders feel manageable individually but add up to $100,000, which at a 5% margin represents the entire profit on a $2 million job.
5. Reduce Rework Through Better Communication and QA/QC
Best for: Eliminating the 5 to 10% of project costs that get spent doing the same work twice.
Rework is pure waste. It consumes labor, materials, and schedule without adding any value. Miscommunication causes 26% of all rework, while bad data or inaccurate information accounts for 14 to 22%. That means roughly 40 to 48% of rework is preventable through better information flow alone.
The financial case is clear: companies with consistent QA/QC processes are 25 to 28% more likely to achieve profit margins above 3%. Nearly two in three companies (56%) with standardized quality processes keep rework costs under 5% of project budget, compared with only 37% of companies without standards.
How to implement:
Require daily field reports with photo documentation. Issues caught on Day 1 cost a fraction of issues caught on Day 10.
Hold weekly coordination meetings with all trades working simultaneously on site. Spatial and scheduling conflicts are the top cause of field rework.
Implement a pre-installation checklist for every major trade. Verify substrate conditions, layout accuracy, and material availability before work begins.
Common mistake: Treating QA/QC as a punch list activity at the end of the project. By the time you’re making a punch list, the expensive rework has already happened. Quality control belongs at the front of every phase, not the back.
A PMI study found that poor communication leads to one-third of construction project failures. Investing in clear communication protocols is not overhead. It’s cost control.
6. Use Purchasing Power Through Buying Groups and Vendor Partnerships
Best for: Reducing material costs, which represent the single largest controllable expense on most projects.
This is the contractor cost control strategy that almost nobody talks about. Materials typically account for 40 to 60% of construction project costs, yet most contractors negotiate in isolation. Research shows that most companies compare only 3 to 4 supplier quotes per purchase because there simply isn’t time for more.
The result? Contractors leave significant money on the table on every job.
Group purchasing organizations (GPOs) and contractor buying alliances pool volume across dozens or hundreds of member companies to negotiate national pricing programs that individual contractors could never access alone. Established multi-trade contractors using bulk purchasing power report securing discounts of 8 to 15% on construction materials.
How to implement:
Evaluate your annual material spend across all projects. Most contractors are surprised by the total when they add it up. That aggregate number is your negotiating power.
Join a contractor purchasing alliance that pools buying power across members. The volume of the group gives you pricing that matches or beats what only the largest national firms can negotiate independently.
Build long-term vendor partnerships rather than shopping every purchase to the lowest bidder. Consistent volume with preferred suppliers unlocks rebate programs, priority delivery, and pricing stability during volatile markets.
Track vendor rebates separately from project costs. Many contractors qualify for annual rebates they never claim because nobody is tracking the spend thresholds.
Common mistake: Treating procurement as a clerical function rather than a strategic one. Your sourcing decisions directly impact margins on every job. A solid construction sourcing strategy can improve profitability more than winning one additional project per year.
Between 2021 and 2024, construction material prices rose 25 to 40% in major markets. In that kind of environment, purchasing leverage isn’t optional. It’s survival. Contractors interested in understanding how collective purchasing works should explore the model before their next major material buy.
The Math of Collective Sourcing
Expense Category | Individual Contractor Price | Buying Group Price (Est.) | Annual Savings ($1M Spend) |
Raw Materials | List Price | 8% – 12% Discount | $80,000 – $120,000 |
Equipment Rental | Standard Rate | 15% Preferred Rate | $15,000 |
Indirect Spend | Market Rate | 10% Negotiated Rate | $10,000 |
Total Impact | $1,000,000 | $855,000 – $895,000 | $105,000+ |
7. Consolidate Trades to Cut Coordination Overhead
Best for: Reducing the hidden costs of managing multiple subcontractors across a single project.
Every additional subcontractor on a project adds coordination overhead: scheduling calls, RFI responses, conflict resolution, separate invoicing, insurance tracking, and finger-pointing when something goes wrong. Fragmented contractor approaches typically result in 15 to 20% budget overruns compared to multi-trade service providers.
Practitioners in the field confirm this. Mark III Construction notes that multi-trade subcontractors provide “speed, cost savings, and accountability” by reducing rework, eliminating clashes in the field, and decreasing wasted resources and materials. Projects with individual contractors require 3 to 5 times more communication touchpoints than those managed under a multi-trade firm.
How to implement:
Identify project scopes where multiple trades overlap (site work, concrete, and paving, for example, are frequently bundled under one multi-trade contractor).
Compare the total cost of hiring separate subs, including your internal coordination time, against a single multi-trade proposal.
On larger projects, multi-trade approaches reduce labor costs by approximately 12 to 18% through optimized crew allocation and complete projects 15 to 30% faster.
Common mistake: Comparing only direct bid prices without accounting for coordination costs. A multi-trade bid might appear 5% higher than the sum of individual bids, but when you factor in your PM’s time, scheduling delays, and change order exposure, it’s often cheaper.
Understanding your purchasing leverage as a buyer of subcontractor services follows the same logic as material purchasing: consolidated volume creates better pricing.
8. Adopt Technology for Real-Time Cost Visibility
Best for: Replacing manual tracking systems that hide problems until it’s too late to fix them.
61% of construction professionals report that technology reduced project errors. The World Economic Forum estimated that full-scale digitization could save $1.2 trillion in design, engineering, and construction phases globally. Those are big numbers, but the practical case is simpler.
Spreadsheet errors are rampant in construction. Professor Raymond Panko’s research on spreadsheet accuracy found significant error rates across industries. In construction procurement, a misplaced decimal point in a cost comparison can mean choosing the wrong supplier entirely.
How to implement:
Start with job costing software that connects field data (timesheets, purchase orders, subcontractor invoices) to your budget in real time. Don’t try to implement everything at once.
Require mobile-based daily reporting from superintendents. Paper reports that arrive three days late are useless for cost control.
Use dashboards that show cost-to-complete projections, not just cost-to-date. Knowing you’ve spent $800,000 is meaningless without knowing you’re 60% complete.
Common mistake: Buying expensive software and expecting it to solve cost control automatically. Technology is a visibility tool. It shows you problems faster. You still need the processes (monthly forecasts, labor tracking, change order review) to act on what the data reveals.
Essential Tools for Real-Time Cost Visibility
To implement Strategy #8 effectively, your “Tech Stack” should include:
ERP/Accounting: For committed cost tracking vs. actuals (e.g., Procore, Sage, or Acumatica).
Field Productivity: For real-time labor cost coding.
BIM/VDC Software: To identify clashes that lead to Strategy #5’s rework issues.
Sourcing Platforms: To manage the purchasing power discussed in Strategy #6.
9. Build Preventive Maintenance Into Your Cost Planning
Best for: Property owners and facility managers who want to control long-term costs, not just project costs.

This strategy shifts the contractor cost control conversation from individual projects to lifecycle economics. Every dollar of deferred maintenance typically costs $3 to $7 in future repairs. That’s not a rough estimate. A landmark Jones Lang LaSalle study analyzing 14 million square feet of commercial properties found that preventive maintenance delivers a 545% return on investment over a 25-year period.
Asphalt provides a clear example. A parking lot that receives regular sealcoating, crack sealing, and timely overlays can last 25 to 30 years. The same parking lot with no maintenance program might need full replacement in 12 to 15 years at five to ten times the cost of a proactive maintenance schedule.
How to implement:
Conduct a facility condition assessment that identifies every maintenance item and its current state. Prioritize by cost of delay, not cost of repair.
Establish a rotating maintenance calendar that schedules work before failures occur. Crack sealing at $0.50 per linear foot is cheaper than base repair at $15 per square foot.
Budget for maintenance as an annual operating expense, not an emergency capital expenditure. The math always favors prevention.
Common mistake: Viewing maintenance as discretionary spending that can be deferred when budgets are tight. Deferral doesn’t save money. It borrows from the future at a 3x to 7x interest rate.
10. Conduct Post-Project Audits and Annual Reviews
Best for: Turning past mistakes into future savings through systematic analysis.
Most contractors finish a project, close out the paperwork, and move on. That’s a missed opportunity. Post-project audits compare actual costs against original estimates across every category, and the patterns they reveal are often surprising.
Practitioner analyses suggest that companies implementing structured procurement and real-time budget tracking typically see measurable improvement within 2 to 3 projects. That’s a realistic timeline. The first audit reveals your blind spots. The second confirms the patterns. The third proves the corrective actions are working.
How to implement:
Within 30 days of substantial completion, conduct a full cost audit comparing estimated vs. actual costs for every budget line item.
Identify the top three categories that overran and the top three that came in under budget. Look for systemic causes, not one-time events.
Feed audit findings directly into estimating templates for future projects. If concrete has averaged 8% over estimate across five projects, adjust the estimating default.
Conduct an annual review across all completed projects to identify company-wide trends in cost performance.
Common mistake: Conducting audits but not changing estimating practices. The audit has zero value if the same optimistic estimates go out the door on the next bid.
Regional differences matter here too. Southern states like Texas and Florida offer higher contractor margins due to favorable tax environments and strong construction demand. Contractors in these markets have more room for error, but they also have more to gain from tightening cost controls on what are typically larger, higher-volume projects.
Putting It All Together
The common thread across all 10 of these contractor cost control strategies is visibility. You can’t control what you can’t see, and most cost overruns happen not because contractors make bad decisions, but because they make decisions with bad information, or no information at all.
At 4 to 6% net margins, every percentage point matters. A contractor running $10 million in annual revenue at a 5% margin nets $500,000. Implementing even three or four of these strategies, real-time labor tracking, purchasing group membership, monthly forecasting, and post-project audits, can realistically improve margins by 2 to 3 points. On $10 million in revenue, that’s an additional $200,000 to $300,000 in profit.
The strategy with the most untapped potential for most contractors is purchasing leverage. Materials represent 40 to 60% of project costs, yet most contractors negotiate alone. A contractor group purchasing organization pools the buying power of many firms to secure pricing that individual companies simply cannot access. If you haven’t explored this model, it’s worth understanding what’s available before your next major procurement cycle.
Cost control in construction is not about cutting corners. It’s about building better systems so that the profit you estimated actually shows up in your bank account.
Frequently Asked Questions
What is contractor cost control?
Contractor cost control is the set of processes, tools, and strategies that contractors and project managers use to keep construction project expenses within budget. It includes estimating, budget forecasting, labor tracking, procurement management, change order control, and post-project auditing. The goal is to protect profit margins by identifying and addressing cost deviations before they become significant overruns.
What percentage of construction projects go over budget?
Research spanning 20 countries over 70 years found that 85% of construction projects experienced cost overruns, with an average overrun of 28%. KPMG’s data is similarly stark: only 25% of construction projects finish within 10% of their original budget.
What is the biggest cause of construction cost overruns?
Inaccurate initial estimates are the most common single cause, contributing to overruns in approximately 70% of projects. Scope creep is the second most common cause, affecting 52% of projects and adding an average of 27% to budgets when it occurs.
How do buying groups help contractors control costs?
Buying groups and group purchasing organizations pool the purchasing volume of many contractor members to negotiate national pricing, bulk discounts, and rebate programs with major suppliers. Members typically save 8 to 15% on construction materials compared to negotiating independently. For contractors spending hundreds of thousands or millions annually on materials, those percentages translate to significant margin improvement. Learn more about how contractor purchasing networks deliver GPO savings.
How much does rework cost on a typical construction project?
Rework typically consumes 5 to 10% of total project costs. On a $5 million project, that’s $250,000 to $500,000 in waste. Companies with consistent QA/QC processes are 56% likely to keep rework costs under 5% of budget, compared to 37% for companies without standardized quality processes.
What is the ROI of preventive maintenance vs. deferred maintenance?
Every dollar of deferred maintenance costs $3 to $7 in future repairs. A Jones Lang LaSalle study of 14 million square feet of commercial property found that preventive maintenance delivers a 545% ROI over 25 years. The math overwhelmingly favors proactive maintenance schedules over reactive repairs.
How quickly can a contractor see results from improved cost control?
Practitioners report that companies implementing structured procurement and real-time budget tracking see measurable improvement within 2 to 3 projects. The first project under new processes establishes a baseline. The second confirms patterns. By the third, corrective actions produce quantifiable savings.
What are typical profit margins for commercial contractors?
Commercial construction net profit margins average 4% to 6%. Specialty trade contractors perform better, with net margins of 6.9% to 8.5%. The thin margins in general contracting make cost control essential, because even small overruns can eliminate profit entirely.

Recent Comments