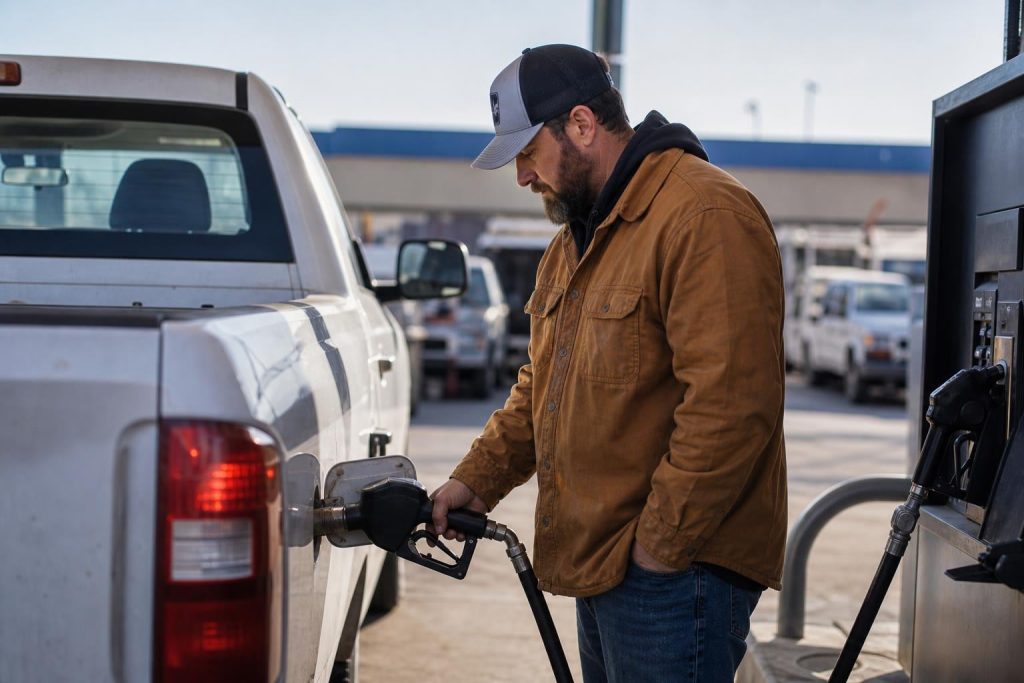
TL;DR
A contractor fleet of ten vehicles easily burns through $120,000 to $200,000 in fuel every year, and diesel hit $5.59 per gallon in May 2026. This guide covers ten specific tactics, from cutting idle time and coaching drivers to using fleet fuel cards and building fuel escalation clauses into your contracts. Most contractors can reduce fuel spending by 15–30% by stacking just three or four of these strategies. The biggest overlooked win: stop burying fuel in overhead and start tracking it per job so your bids actually reflect reality.
Quick Answer: How Can Contractors Save Fuel Costs?
Contractors can typically reduce fleet fuel expenses by 15% to 30% by combining several proven strategies instead of relying on a single solution. The fastest improvements usually come from reducing idle time, coaching drivers, using fleet fuel cards, improving preventive maintenance, and tracking fuel costs by individual job instead of treating fuel as overhead.
For most construction companies, fuel savings come from three categories:
Category | Typical Savings |
|---|---|
Driver behavior improvements | 10–15% |
Vehicle and equipment efficiency | 5–10% |
Purchasing and fuel management | 3–8% |
The highest-performing contractors continuously monitor fuel usage, identify waste quickly, and build fuel price volatility into project pricing rather than absorbing unexpected costs.
Why Contractor Vehicle Fuel Savings Matter More Than Ever
Diesel fuel costs make up 20% to 30% of operating expenses for contractors running fleets and heavy equipment. For diesel-powered construction equipment specifically, fuel can represent over 35% of total operational costs. At 2026 prices, a construction company running ten vehicles and a few pieces of heavy equipment spends somewhere between $120,000 and $200,000 annually just keeping tanks full.
That’s not a rounding error. That’s a line item that directly determines whether you win bids and whether those bids make money.
The problem goes deeper than the pump price. As one construction business resource noted, most contractors absorb fuel as general overhead, spreading it evenly across every job regardless of actual consumption. That means simple residential projects subsidize fuel-heavy commercial work, and bids are wrong on both ends. Contractor vehicle fuel savings aren’t just about spending less at the pump. They’re about knowing your real costs so you can price jobs accurately.
For a broader look at where fuel fits within your total operational cost savings picture, it’s worth understanding how fuel interacts with materials, labor, and equipment costs.
Here are ten tactics, organized from quick wins to strategic shifts, each with real dollar estimates.
At-a-Glance: Fuel Savings Tactics Compared
Tactic | Effort Level | Estimated Savings | Time to Impact | Best For |
|---|---|---|---|---|
Audit your fuel baseline | Low | Enables 15–25% overall reduction | 1–2 weeks | Everyone (start here) |
Cut idle time | Medium | 10–30% of idle fuel waste | 1–2 weeks | Equipment-heavy contractors |
Use fleet fuel cards | Low | 3–8% via rebates + fraud reduction | Immediate | All fleet sizes |
Coach drivers on fuel-efficient habits | Medium | 10–15% | 2–4 weeks | Fleets with 5+ drivers |
Stay on top of preventive maintenance | Low | 3–7% | Ongoing | All contractors |
Right-size your fleet | High | 20–40% per vehicle swapped | 1–3 months | Mixed-use fleets |
Optimize routes between job sites | Medium | 5–10% | 1–2 weeks | Multi-site contractors |
Negotiate bulk fuel purchasing | Medium | 5–15¢/gallon | 2–4 weeks | Mid-size fleets and buying groups |
Prevent fuel theft on job sites | Medium | Recovers 3–6% of spend | 1 month | Job-site-heavy operations |
Track fuel per job to sharpen bids | High | Indirect, improves bid accuracy | 1–3 months | Bid-based contractors |
Estimated Annual Savings by Fleet Size
This gives Google another structured table.
Fleet Size | Annual Fuel Spend | Possible Savings (20%) |
|---|---|---|
3 Vehicles | $40,000 | $8,000 |
5 Vehicles | $70,000 | $14,000 |
10 Vehicles | $150,000 | $30,000 |
20 Vehicles | $300,000 | $60,000 |
50 Vehicles | $800,000 | $160,000 |
What Causes High Fuel Costs for Contractors?
Many contractors assume fuel costs are driven primarily by diesel prices. In reality, pump prices are only one part of the equation. Most fleet fuel waste comes from operational inefficiencies that can be measured and corrected.
The most common causes include:
Excessive equipment idling
Poor route planning
Aggressive driving habits
Underinflated tires
Poor preventive maintenance
Fuel theft
Oversized vehicles used for light-duty work
Fuel treated as overhead instead of tracked by project
Addressing these issues often produces larger savings than simply finding cheaper fuel.
1. Audit Your Fuel Baseline Before Changing Anything

Best for: Every contractor, regardless of fleet size. This is step zero.
You can’t reduce what you haven’t measured. Before chasing savings through new tools or programs, establish where your money is actually going.
Key metrics to track:
Fuel cost per mile and cost per hour for each vehicle
Miles per gallon by vehicle and driver
Idle time as a percentage of total engine hours
Fuel consumption by asset class (trucks vs. equipment vs. vans)
Utilization ratio: hours worked vs. fuel burned
Many contractors discover that two or three vehicles account for a wildly disproportionate share of total fuel spend. Without baseline data, those outliers stay invisible. For guidance on building measurement systems into your purchasing process, see this purchasing efficiency and KPIs guide.
What practitioners actually find: Contractors on forums consistently report that their initial audit reveals at least one “fuel hog” vehicle that’s costing 40–60% more per mile than comparable trucks in the same fleet. Sometimes the fix is mechanical. Sometimes it’s the driver. You won’t know until you look.
Savings potential: The audit itself doesn’t save money, but it sets the foundation for a realistic 15–25% overall reduction once you act on what you find.
2. Cut Idle Time, the Biggest Hidden Drain
Best for: Equipment-heavy contractors running dozers, excavators, and trucks that sit running at job sites.
Between 10% and 30% of construction equipment fuel consumption goes to nonproductive idling. That’s fuel burned while machines sit running but accomplish nothing.
The numbers add up fast. A typical commercial truck burns 0.6 to 1 gallon per hour at idle. Scale that across a fleet and the waste is staggering: a fleet of forty trucks idling two hours per day wastes roughly 29,000 gallons per year, about $100,000 at 2026 fuel prices.
Real-world example: Royal Electric used idling reports to identify high-consumption habits across their fleet. Simple behavioral fixes, not expensive technology, led to $9,000 per month in fuel savings.
How to reduce idle time:
Install idle-time tracking (many telematics systems include this)
Set clear idle-time policies with specific thresholds (e.g., 5 minutes max)
Share weekly idle reports with operators and crew leads
Use auxiliary power units for cab climate control instead of running main engines
Shut down equipment during lunch breaks, staging delays, and weather holds
Idling doesn’t just waste fuel. It accelerates wear on diesel particulate filters, injectors, and engine internals, compounding maintenance costs on top of fuel waste.
Savings potential: 10–30% reduction in fuel waste per asset, depending on current idle habits.
3. Use Fleet Fuel Cards for Discounts and Fraud Prevention
Best for: Any contractor with three or more vehicles. Low effort, immediate impact.
Fleet fuel cards serve two purposes: they reduce the per-gallon price, and they create a paper trail that makes fraud and unauthorized purchases much harder to hide.
Discount structure:
Per-gallon rebates typically range from 5¢ to 45¢ depending on volume and program
Some programs report average savings of 42¢ per gallon when combining rebates with network pricing
Volume-based tiers reward larger fleets, but even small operations benefit from base discounts
Fraud prevention features:
Purchase controls by time of day, day of week, and geographic radius
Tank capacity matching (flags a 25-gallon fill on a 20-gallon tank)
Driver-to-vehicle pairing to prevent unauthorized fueling
Real-time transaction alerts
The fraud angle matters more than most contractors realize. Construction industry leaders estimate that up to 22% of fleet payments are lost to fraud or theft. Fleet cards don’t eliminate theft entirely, but they make it visible.
For a deeper breakdown of how fleet fuel cards work, see our fleet fuel cards glossary and guide.
Limitations:
Not all cards are accepted at every station, which can force drivers to detour
Some programs lock you into specific fuel networks with limited rural coverage
Administrative setup takes a few days, and driver training on card policies is essential
Savings potential: 3–8% on total fuel spend through combined rebates and fraud prevention.
4. Coach Drivers on Fuel-Efficient Habits
Best for: Fleets with five or more drivers where individual behavior varies significantly.
Driver behavior is the single largest controllable factor in fleet fuel consumption, accounting for up to 33% of the variance in fuel economy between vehicles in the same fleet. Two identical trucks driven by different people can show wildly different fuel numbers.
According to the U.S. Department of Energy, aggressive driving, meaning rapid acceleration, hard braking, and excessive speeding, lowers gas mileage by 15% to 30% at highway speeds and 10% to 40% in stop-and-go traffic.
What works:
Short monthly eco-driving training sessions (even 15 minutes)
Scorecards showing each driver’s MPG compared to fleet average
Incentive programs: bonuses for top fuel performers, gamification between crews
Telematics-based coaching that flags harsh braking and rapid acceleration in real time
Fleets that implement structured driver training programs consistently report 10–15% annual fuel savings. The key is sustainability. A one-time lecture fades within weeks. Ongoing scorecards and incentives keep the gains. This kind of behavioral improvement also fits within a broader contractor margin improvement strategy.
Limitations:
Requires management buy-in and consistent follow-through
Some experienced operators resist being “coached” on driving
Gains erode if tracking and incentives are dropped after the initial push
Savings potential: 10–15% fuel reduction across the fleet.
5. Stay on Top of Preventive Maintenance
Best for: All contractors. Low effort, steady returns.
Deferred maintenance bleeds fuel economy in ways that don’t show up until the numbers are tracked. Multiple small inefficiencies compound into a meaningful cost.
The specifics:
Underinflated tires cost about 0.3% in fuel economy for every 1 PSI below recommended pressure. Keeping tires properly inflated improves mileage by up to 3%.
A TMC report found that a tire underinflated by just 10 PSI reduces fuel economy by about 1%.
Engine tuning issues can cost 4% or more in fuel economy.
Clogged air filters, degraded oil, worn spark plugs, and dirty fuel injectors all add drag.
None of these individually seem like a big deal. Together, they can easily cost 5–7% of your fuel budget. On a $150,000 annual fuel spend, that’s $7,500 to $10,500 in preventable waste.
Practical steps:
Check tire pressure weekly, not just at service intervals
Follow OEM-recommended oil change and filter replacement schedules
Address check-engine lights immediately (they often indicate fuel system issues)
Include fuel economy metrics in your maintenance review process
Savings potential: 3–7% improvement in fuel efficiency.
6. Right-Size Your Fleet: Stop Sending Dump Trucks for Paperwork
Best for: Mixed-use fleets where heavy trucks get dispatched for light-duty tasks.
This is one of the highest-impact contractor vehicle fuel savings tactics, but also one of the hardest to implement because it means changing habits.
Many contractors default to sending a 2500 HD or 3/4-ton truck for every task, even when the job only requires carrying a few tools and some paperwork. A half-ton truck averaging 18 MPG versus a 3/4-ton at 12 MPG represents a 33% fuel cost difference per mile. Over thousands of miles per month, that gap is enormous.
Practitioners on contractor forums offer blunt examples. One electrical contractor on the Mike Holt forum shared that he switched to a minivan for service calls, getting 22 MPG instead of the 10 MPG his work truck pulled. That’s more than double the fuel economy for tasks that never required a full-size truck in the first place.
Right-sizing doesn’t mean downsizing your entire fleet. It means matching the vehicle to the task. Keep your heavy trucks for heavy work. But for site visits, inspections, estimating trips, and light service calls, a smaller vehicle or van saves real money.
Implementation steps:
Categorize your daily tasks by vehicle requirement (heavy, medium, light)
Track which trucks are dispatched for light-duty work over a two-week period
Add one or two fuel-efficient vehicles for tasks that don’t need a full-size truck
Reassign heavy trucks exclusively to jobs that justify their fuel consumption
For more on matching resources to actual need, this fleet management guide covers vehicle allocation strategies.
Limitations:
Requires upfront investment in additional vehicles or leases
Crews may resist driving “smaller” vehicles
Scheduling complexity increases with a mixed fleet
Savings potential: 20–40% fuel reduction per vehicle that gets reallocated to an appropriate-size alternative.
7. Optimize Routes Between Job Sites
Best for: Contractors managing multiple active job sites simultaneously.
Route optimization can reduce fuel costs by 5–10%, and it doesn’t require expensive software. Construction-specific route planning differs from delivery routing because the goals are different. You’re not trying to hit twenty stops in order. You’re trying to sequence site visits, material pickups, and equipment moves to minimize backtracking and dead miles.
Practical tactics:
Stage materials closer to active projects instead of running back to the yard
Sequence daily site visits geographically rather than by priority
Avoid peak traffic windows for non-urgent trips
Use GPS tools that optimize for fuel efficiency, not just fastest route (shorter isn’t always most fuel-efficient)
Consolidate supply runs so one trip serves multiple crews
The construction context matters here. A general contractor running crews across a metro area might have drivers crisscrossing the same routes three times a day without realizing it. Even basic planning, just looking at a map each morning, can eliminate 10–15% of unnecessary mileage.
Savings potential: 5–10% fuel reduction.
8. Negotiate Bulk Fuel Purchasing and Use Buying Groups
Best for: Mid-size contractors and anyone participating in a purchasing alliance.
Retail diesel prices include a healthy margin for the gas station. Buying fuel in bulk, through direct supplier relationships, on-site fuel delivery, or transfer tanks, cuts out that retail markup.
Bulk purchasing options:
On-site fuel tanks with scheduled deliveries (eliminates retail pricing entirely)
Transfer tanks on flatbeds for field refueling
Fuel hedging contracts that lock in prices during volatile markets
Group purchasing organizations that pool volume from multiple contractors to negotiate better per-gallon rates
That last point deserves attention. A five-truck contractor has limited bargaining power with a fuel supplier. But fifty contractors pooling their volume through a contractor purchasing alliance suddenly command the kind of volume that gets a supplier’s attention.
Regional pricing also matters. Gulf Coast and Southeastern U.S. diesel prices consistently rank among the lowest nationally. Contractors operating in Tennessee, Alabama, Mississippi, and Louisiana already have a built-in cost advantage, with Texas diesel averaging around $4.96 per gallon compared to national averages well above $5.00. Buying smart within a low-cost region compounds the savings.
Limitations:
On-site tank storage requires space and permitting
Fuel hedging introduces contract complexity
Group purchasing requires membership and coordination
Savings potential: 5–15¢ per gallon through collective purchasing power, which on a 30,000-gallon annual consumption adds up to $1,500 to $4,500.
9. Prevent Fuel Theft on Job Sites
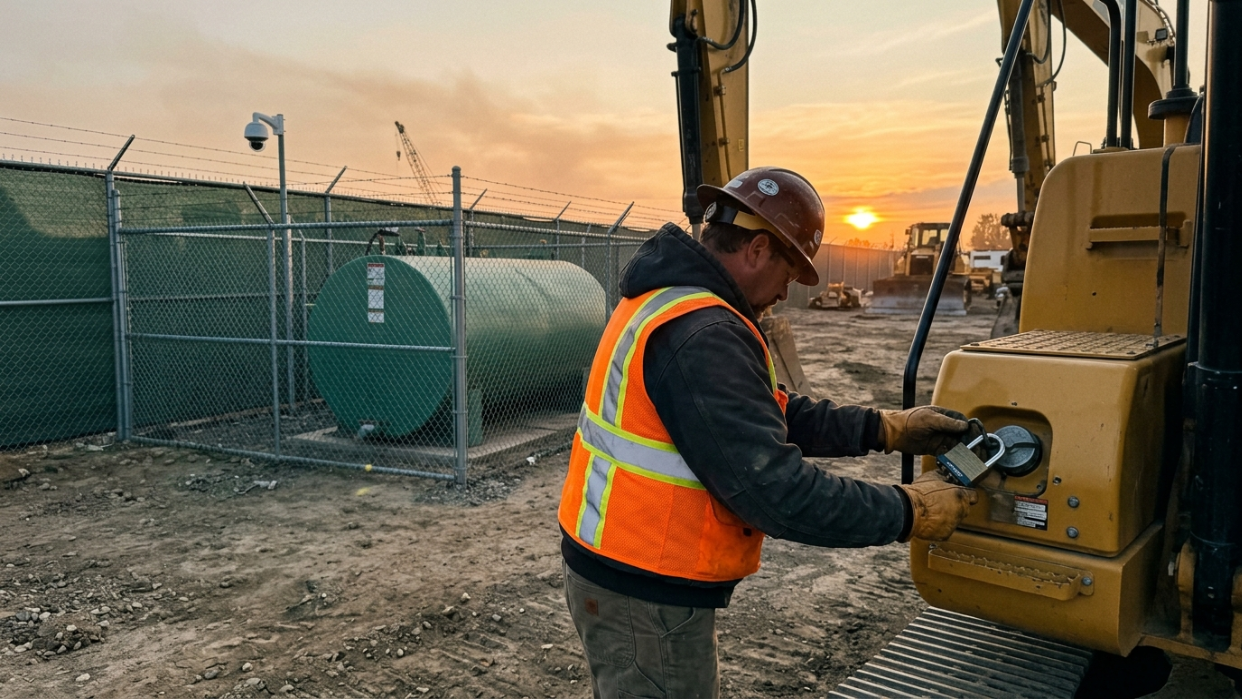
Best for: Contractors with equipment stored overnight at remote or unsecured job sites.
Fuel theft is one of the most underestimated drains on contractor vehicle fuel savings. According to NAFA, 83% of fleets experience regular fuel theft, and most incidents go undetected for months. NAFA also estimates that fuel theft can account for up to 6% of a fleet’s total fuel cost.
Construction sites are particularly vulnerable. They’re often remote, lack overnight security, and contain high-value diesel tanks that are easy targets. At $5.59 per gallon, even a few siphoned tanks per week adds up fast.
Prevention tactics:
Locking fuel caps on all vehicles and equipment
Fuel-level sensors that alert to unexpected drops overnight
Well-lit, secure parking areas for vehicles and equipment
GPS tracking on fuel tanks and high-value equipment
Regular reconciliation of fuel card purchases against actual tank levels and odometer readings
Cameras at fuel storage locations
Companies that implement monitoring systems report a 78% reduction in theft during the first year. The investment in basic security hardware pays for itself within months.
For related strategies around tightening up construction expense management, theft prevention is one piece of a larger control framework.
Savings potential: Recovers 3–6% of fuel budget that was walking off the job site.
10. Track Fuel Per Job to Sharpen Your Bids
Best for: Bid-based contractors who currently lump fuel into general overhead.
This is the tactic no one talks about, and it might be the most valuable one on this list.
Most contractors treat fuel as overhead. It gets spread evenly across every project, whether that job used one truck for a week or five trucks for three months. The result: your simple residential jobs subsidize your fuel-heavy commercial projects, and your bids are inaccurate on both ends.
A contractor on ContractorTalk captured the bidding dilemma perfectly: “If I bid a job next week at $3.25 a gallon, get it, and start it in July when diesel may be $4.50, I am screwed. If I bid it at $4.50 and do not get it, I am screwed.” Another practitioner in the same thread offered a practical solution: “If you get a job that will be a long one, say more than a year to complete, then you can incorporate a fuel clause into your bid.”
How to implement job-level fuel tracking:
Assign fuel card transactions to specific job codes
Use telematics GPS data to allocate vehicle hours to projects
Track equipment fuel consumption by job site location
Move fuel from overhead to direct job cost in your accounting system
When fuel moves from overhead to direct cost, two things happen. First, your overhead rates drop, making your bids more competitive on light-use jobs. Second, your fuel-heavy bids reflect actual cost, protecting your margins.
One Equipment World forum contributor put it bluntly: “I can’t come do a normal job where I’ll burn say 100 gallons of fuel on the job and it cost me $200, and now it’s going to cost me $500.” That $300 difference has to live somewhere. If it’s buried in overhead, every bid absorbs it, even jobs that barely touch fuel.
Savings potential: Indirect but significant. Improves profitability across your entire book of work by ensuring you win the right jobs at the right prices.
Bonus: Build a Fuel Price Volatility Buffer into Your Contracts
Diesel prices swung from roughly $3.53 per gallon in January 2026 to $5.59 by May, a nearly 60% increase in five months. For contractors bidding work months before it starts, that volatility can destroy margins on what looked like a profitable job.
Fuel escalation clauses are the answer. These contract provisions tie fuel cost adjustments to a published index (typically the EIA weekly diesel price report) and allow price adjustments when fuel moves beyond a specified threshold, often 10–15% above the bid-date price.
Both parties benefit. The contractor is protected from spikes, and the client is protected from inflated contingency padding. It’s a fairer structure than either gambling on future prices or burying a worst-case scenario into every bid.
Even without a formal escalation clause, building a 10% fuel contingency into fuel-heavy bids is better than bidding at today’s pump price and hoping for the best.
Stacking Tactics: What the Math Looks Like
No single tactic will cut your fuel bill in half. But stacking three or four creates a compounding effect.
Consider a contractor spending $150,000 per year on fuel:
Cut idle time by 15%: saves $22,500
Fleet fuel cards at 5% savings: saves $7,500
Driver training at 10%: saves $15,000
Preventive maintenance at 4%: saves $6,000
Even accounting for overlap between tactics, a realistic combined savings of 20–25% puts $30,000 to $37,500 back into margin annually. That’s money that goes directly to the bottom line.
For a complete picture of how fuel savings fits alongside material costs, equipment efficiency, and labor optimization, the construction procurement savings guide covers the full spectrum of contractor cost reduction.
Example Fuel Savings Calculation
A contractor operates:
10 trucks
Annual fuel spend: $150,000
After implementing:
15% idle reduction
10% driver coaching improvement
5% fleet fuel card savings
4% maintenance improvement
Estimated annual savings:
Strategy | Estimated Savings |
|---|---|
Idle reduction | $22,500 |
Driver coaching | $15,000 |
Fuel cards | $7,500 |
Maintenance | $6,000 |
Potential annual savings: more than $30,000 after accounting for overlap between initiatives.
Frequently Asked Questions
How much can a contractor realistically save on fuel per year?
A contractor running a 10-vehicle fleet spending $150,000 annually on fuel can realistically save $15,000 to $45,000 per year by implementing three to five of the tactics in this guide. The biggest single wins typically come from idle-time reduction and driver behavior coaching.
What percentage of a contractor’s operating costs is fuel?
Fuel typically accounts for 20% to 35% of operating costs for contractors running fleets and heavy equipment. For diesel-powered construction equipment specifically, fuel can exceed 35% of operational costs. The exact percentage depends on fleet size, equipment type, and regional fuel prices.
Do fleet fuel cards actually save money, or are they just tracking tools?
Both. The discount component (5¢ to 45¢ per gallon in rebates depending on program and volume) delivers direct savings. The tracking and control features prevent fraud and unauthorized purchases, which industry data suggests can account for up to 22% of fleet fuel payments. The combination of discounts plus fraud prevention typically saves 3–8% on total fuel spend.
How do fuel escalation clauses work in construction contracts?
A fuel escalation clause ties fuel cost adjustments to a published price index, usually the EIA weekly diesel report. When the index price moves beyond an agreed threshold (commonly 10–15% above the bid-date price), the contract allows a corresponding adjustment to the project price. This protects both the contractor from price spikes and the client from excessive contingency padding.
Is it worth tracking fuel by individual job?
Yes. Tracking fuel per job instead of burying it in overhead reveals the true cost of fuel-heavy projects and prevents low-fuel jobs from subsidizing high-fuel ones. This makes every bid more accurate, which improves win rates on competitive jobs and protects margins on equipment-intensive work.
What is the single fastest way to reduce contractor fleet fuel costs?
Addressing idle time. Since 10–30% of construction equipment fuel goes to nonproductive idling, even basic policy changes (shutdown timers, idle-time reports, crew-level accountability) can produce measurable savings within one to two weeks. Royal Electric’s experience, saving $9,000 per month from idle-time reduction alone, shows the scale of opportunity.
How common is fuel theft on construction job sites?
Very common. NAFA data indicates 83% of fleets experience regular fuel theft, with most incidents going undetected for months. Construction sites are especially vulnerable due to remote locations and overnight equipment storage. Basic countermeasures like locking fuel caps, fuel-level sensors, and GPS tracking can reduce theft by 78% in the first year.
Do Southeastern U.S. contractors have a fuel cost advantage?
Yes. Gulf Coast diesel prices are consistently among the lowest in the nation, with Texas averaging around $4.96 per gallon and Louisiana and Mississippi running just above $5.00 compared to national averages well over $5.50 in 2026. Contractors operating in the Southeast already benefit from lower base costs, and smart purchasing strategies compound that regional advantage.

Recent Comments