
TL;DR
Contractor fleet management is the process of tracking, maintaining, and optimizing every vehicle and piece of equipment a contractor owns or rents. It covers everything from GPS tracking and preventive maintenance to fuel costs and the own-vs-rent decision. Contractors who formalize fleet management report 15 to 25% cost reductions in the first year. The key insight: disciplined processes beat expensive technology every time.
Contractor Fleet Management: Quick Answer
Contractor fleet management is the process of tracking, maintaining, and optimizing construction vehicles and equipment to reduce costs, improve utilization, prevent downtime, and increase project profitability.
A successful contractor fleet management program typically includes:
– GPS and telematics tracking
– Preventive maintenance scheduling
– Fuel management
– Asset utilization monitoring
– Total cost of ownership (TCO) analysis
– Safety and compliance management
– Equipment cost allocation to projects
– Buy-vs-rent decision making
Most contractors that implement structured fleet management practices reduce fleet-related costs by 15% to 25% within the first year while improving equipment uptime and project efficiency.
What Is Contractor Fleet Management?
Contractor fleet management is the strategic coordination and oversight of all vehicles, heavy equipment, and support assets used across construction projects. It includes tracking where assets are, keeping them running, controlling what they cost, and deciding when to buy, rent, or replace them.
This sounds simple. It isn’t.
In most industries, “fleet management” means managing company cars or a line of delivery trucks. Construction fleet management is a fundamentally different operation. Contractor fleets include a much broader range of asset types, each with different maintenance cycles, regulatory requirements, and cost profiles. Machines are measured in engine hours, not miles. Utilization patterns shift with seasons and project timelines. Individual assets can be worth $150,000 to $2 million, making lifecycle cost tracking essential for capital expenditure decisions.
For contractors looking to improve operational efficiency, fleet management is often the highest-impact starting point.
What a Contractor Fleet Typically Includes
For commercial concrete and asphalt contractors, the fleet goes well beyond pickup trucks:
On-road vehicles: Concrete mixer trucks, concrete pump trucks, dump trucks, haul trucks, service trucks, flatbeds, pickup trucks
Heavy equipment: Excavators, skid steers, loaders, asphalt pavers, milling machines, rollers
Non-powered assets: Generators, light towers, compressors, trailers, attachments
Managing this mix of on-road CDL vehicles and off-road heavy equipment across multiple active job sites is what makes contractor fleet management more complex than standard commercial fleet operations.
Contractor Fleet Management Benefits
Contractors often focus on equipment acquisition but overlook the long-term impact of fleet management on profitability. A structured fleet management program delivers benefits across operations, finance, safety, and project execution.
Operational Benefits
Increased equipment uptime
Reduced project delays
Improved asset visibility
Faster equipment deployment
Better maintenance planning
Financial Benefits
Lower fuel consumption
Reduced repair expenses
Improved asset utilization
Better replacement planning
More accurate project costing
Safety Benefits
Improved inspection compliance
Better driver accountability
Reduced accident frequency
Lower insurance claims exposure
Strategic Benefits
Better buy-versus-rent decisions
Improved forecasting
Stronger vendor negotiations
Higher equipment resale values
For many contractors, fleet management becomes one of the fastest operational improvement initiatives because equipment costs impact nearly every project.
Core Components of Contractor Fleet Management
Equipment Tracking and Visibility
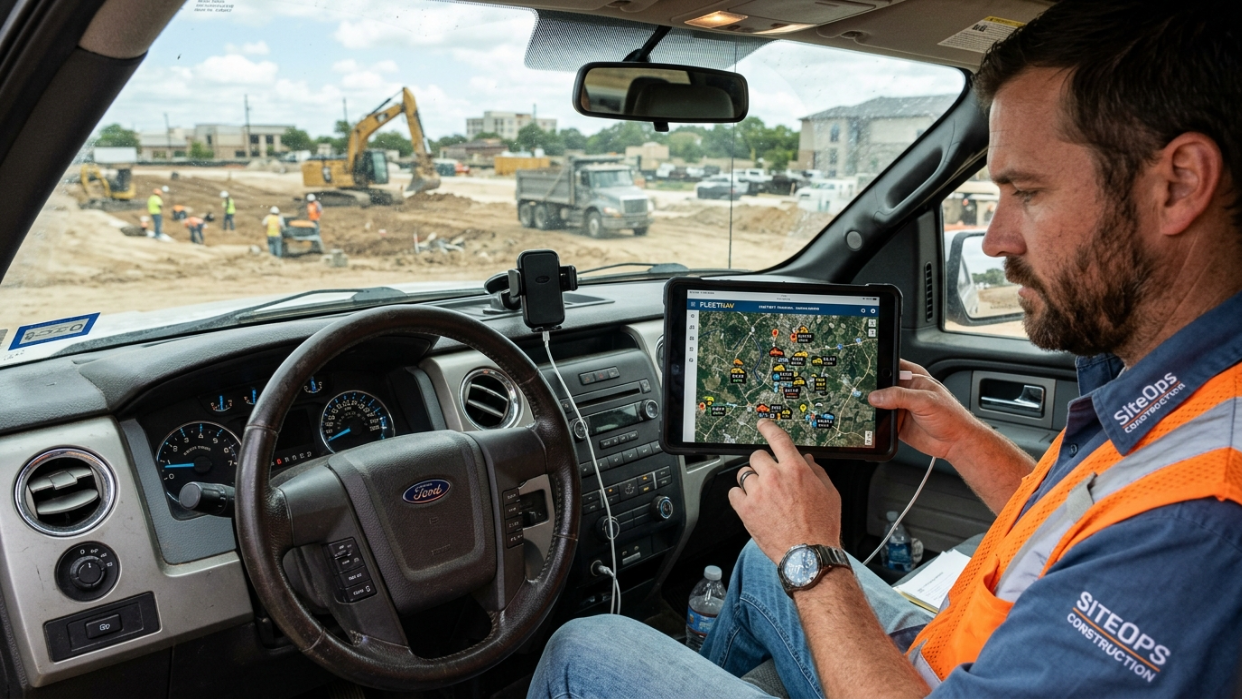
Knowing where your equipment is, and whether it’s actually being used, is the foundation of everything else. GPS telematics systems track real-time location, engine hours, fuel usage, and idle time for mixed fleets operating across construction sites.
Geofencing adds another layer. By creating virtual boundaries around active job sites, contractors can monitor equipment presence, track hours worked on specific projects, and trigger alerts for unauthorized movement. A roller that’s supposed to be on a highway project but shows up at an equipment yard on a Tuesday afternoon becomes visible immediately.
Current telematics hardware costs less than $200 per unit, with monthly service fees of $15 to $30 per asset. Most contractors report a 60 to 90 day payback on telematics investments.
Preventive Maintenance Scheduling
This is where most contractors feel the most pain. Practitioners at CONEXPO 2026 repeatedly cited maintenance management as their top concern. Reactive maintenance and manual tracking simply don’t scale as fleets grow. Contractors frequently mentioned missed preventive maintenance intervals, difficulty tracking service history, and limited visibility into repair costs.
The financial stakes are real. Equipment downtime costs $2,000 to $10,000 per day per asset. According to Deloitte, poor maintenance strategies can reduce a company’s production capacity by 20%.
Here’s a concrete example of what “reactive” actually costs. A mid-size general contractor in Houston had a concrete pump throw a hydraulic pressure fault code. The machine flagged it. The site crew ignored it. The shop never saw it. Three weeks later, the hydraulic pump seized. The contractor paid $18,000 in emergency rental fees, $7,400 in delay penalties, and $4,200 for a mobile technician. Total cost of ignoring one fault code: $36,400.
The fix is straightforward but requires discipline. Construction equipment should be on engine-hour-based PM schedules, not calendar-based or mileage-based ones. A skid steer running 10 hours a day needs service far more often than one running 3 hours a day, regardless of what the calendar says.
For a broader framework on managing these costs, see this guide on contractor cost control.
Fuel Management
Fuel accounts for roughly 42% of the cost of operating a construction fleet. That makes it the single largest operating expense category, and one of the most controllable.
Contractors using GPS tracking and telematics systems report up to 15% savings in fuel consumption. The savings come from identifying excessive idle time, optimizing equipment deployment to reduce unnecessary transport, and catching fuel theft or unauthorized use.
For contractors managing construction expenses across multiple job sites, fuel tracking provides immediate, measurable returns.
How to Reduce Fleet Fuel Costs
Fuel is often the largest operating expense within a contractor fleet. Small improvements in fuel efficiency can create significant annual savings.
Proven Fuel Reduction Strategies
Reduce Idle Time
Excessive idling wastes fuel and accelerates engine wear. Telematics systems can identify operators or assets with high idle rates.
Optimize Equipment Dispatching
Sending the closest available asset to a job site reduces transportation costs and fuel consumption.
Monitor Fuel Theft
Fuel card controls and telematics data help identify unusual fuel usage patterns.
Maintain Proper Tire Pressure
Underinflated tires increase fuel consumption and reduce tire lifespan.
Schedule Preventive Maintenance
Dirty filters, worn injectors, and neglected engines consume more fuel than properly maintained equipment.
Contractors frequently achieve double-digit fuel savings simply by tracking and acting on fuel usage data.
Asset Utilization and the Own-vs-Rent Decision
Most fleet managers use 60 to 70% utilization as the break-even benchmark for ownership. Above that threshold, ownership pulls ahead on total lifecycle cost. Below it, cumulative rental spend stays lower than the combined cost of depreciation, financing, insurance, and maintenance on an owned unit.
This matters more than most contractors realize. Studies show that rental houses currently own over 50% of construction equipment, which suggests the industry is already moving toward rental-heavy models.
The smartest approach for most contractors is a hybrid rent-and-own model driven by telematics data. Own your core fleet (the equipment running at 70%+ utilization) and rent for peak demand and specialty work. But you can’t make this decision without actual utilization data, which brings us back to tracking.
One consultant from For Construction Pros put it bluntly: contractors are really in the equipment rental business internally, doing the same thing a rental company does to generate cash flow and cover debt service. Consequently, they should measure equipment fleet performance the same way a rental company does.
Equipment Ownership vs Rental Comparison
Factor | Ownership | Rental |
|---|---|---|
Initial Cost | High | Low |
Flexibility | Moderate | High |
Maintenance Responsibility | Contractor | Rental Company |
Availability | Guaranteed | Subject to Availability |
Long-Term Cost | Lower at High Utilization | Lower at Low Utilization |
Cash Flow Impact | Significant | Predictable |
Specialty Equipment | Less Efficient | Often Ideal |
General Rule
Above 70% utilization = ownership often wins
Below 60% utilization = renting often wins
Between 60% and 70% = requires TCO analysis
The best decision should always be based on actual utilization and cost data rather than assumptions.
Total Cost of Ownership (TCO)
TCO is where fleet management connects directly to profitability. The median total cost of ownership for a construction fleet asset in 2025 is $9,437, slightly below the fleet-wide average of $10,169.
The most revealing data point is cost per mile by equipment age:
Equipment Age | Cost Per Mile |
|---|---|
0 to 5 years | $0.06 |
6 to 10 years | $0.15 |
10+ years | $1.10 |
That jump from $0.15 to $1.10 after year ten is staggering. It represents the point where escalating repair costs and diminishing availability outweigh the value of continued operation. Plante Moran, a CPA and consulting firm specializing in heavy civil construction, calls this the “sweet spot” for replacement, noting that many organizations still rely on simplistic age-based criteria or run-to-failure strategies instead of actual cost data.
For contractors benchmarking their fleet performance, these numbers provide a starting point. See this guide on construction cost benchmarking for additional metrics.
Safety and Compliance
CDL vehicles in every construction fleet are subject to DVIR pre/post-trip inspections, hours-of-service (HOS) compliance, driver qualification files, and FMCSA documentation requirements. Non-compliance creates both legal liability and insurance cost exposure.
Practitioners report growing interest in dash cameras and other visibility technologies to reduce accident risk. Insurance pressure and increasing liability concerns are driving this trend. As Acuity Insurance warns, having a fleet management program is only the first step. It must be actively monitored and adjusted. An unenforced program can be worse than no program at all, because it creates a paper trail showing the contractor knew the risks and failed to act.
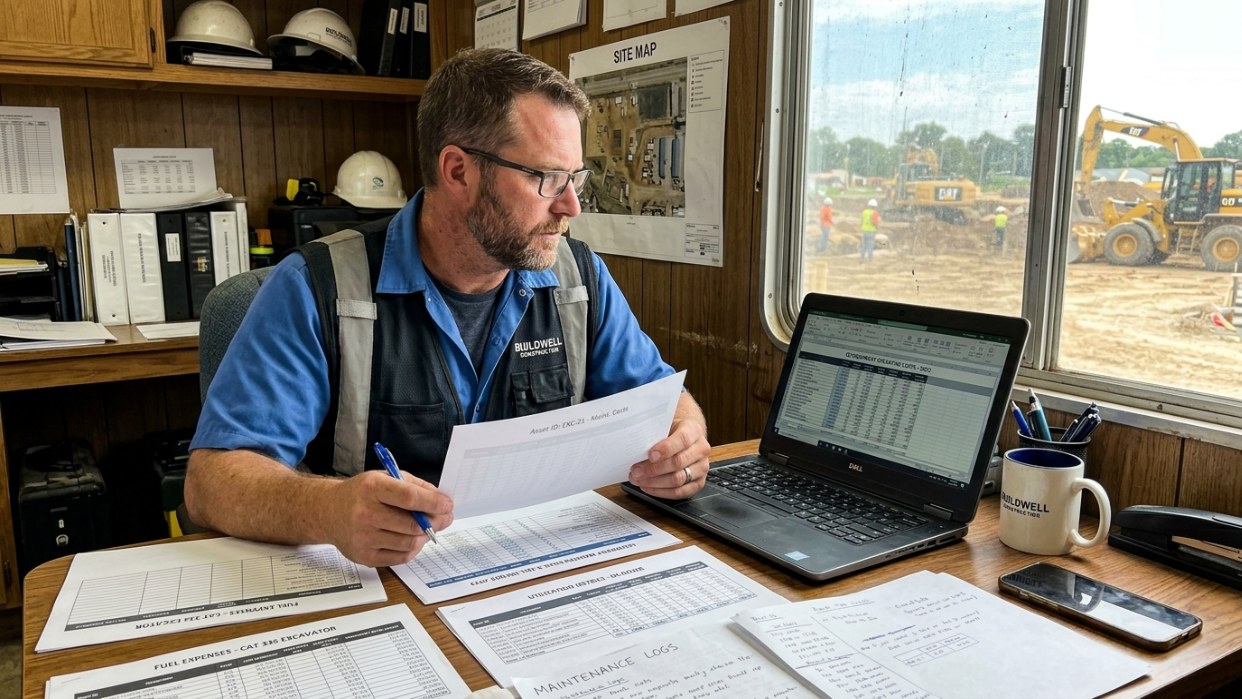
Costing and Job Cost Integration
This is the component most contractors overlook, and the one that matters most for margin protection.
Many contractors treat fleet costs as general overhead. The equipment line shows up as one big number on the P&L, with no visibility into which projects are consuming which assets. This approach obscures the true cost of individual projects and makes it impossible to bid accurately on future work.
The alternative: charge equipment costs to specific project codes, just like labor and materials. Every hour an excavator runs on a site, every gallon of diesel a mixer truck burns on a pour day, should flow into that project’s cost structure.
Contractors using ERP platforms like Vista, Spectrum, and Sage increasingly want equipment data flowing directly into accounting and job cost systems. This eliminates manual entry and improves financial accuracy. The challenge is that many contractors currently run several different, disconnected platforms for telematics, maintenance, field management, cameras, and accounting.
Major Fleet Cost Categories
Understanding where fleet expenses originate helps contractors prioritize improvement efforts.
Cost Category | Typical Share of Fleet Costs | Optimization Opportunity |
|---|---|---|
Fuel | 35-42% | Idle reduction, route optimization |
Maintenance & Repairs | 20-30% | Preventive maintenance |
Depreciation | 15-25% | Lifecycle management |
Insurance | 5-10% | Safety programs |
Tires | 2-5% | Monitoring and rotation |
Licensing & Compliance | 1-3% | Process automation |
Administrative Costs | 2-5% | Software integration |
For most contractors, fuel and maintenance represent the largest opportunities for immediate savings.
Fleet Management Software Features to Look For
As contractors evaluate fleet management solutions, several features consistently deliver the highest return on investment.
Essential Features
GPS tracking
Equipment location history
Preventive maintenance scheduling
Fuel tracking
Utilization reporting
Inspection management
Mobile field access
Advanced Features
AI-powered maintenance alerts
Dash camera integration
Driver behavior monitoring
ERP integration
Automated job costing
Predictive analytics
Contractors should prioritize software that solves operational problems rather than simply adding more data.
Why Contractor Fleet Management Matters for Your Bottom Line
Contractors implementing structured fleet management programs report 15 to 25% cost reductions in the first year. That’s a significant number for an industry where net margins often run in single digits.
But the most important finding from recent fleet benchmark data isn’t about technology. Fleetio’s 2026 report, based on data from over 1 million vehicles and $7 billion in service spend, found that the fleets that succeed aren’t the ones with the newest technology or the biggest budgets. They’re the ones with the most disciplined processes. High compliance rates, clear triage protocols, and speed-to-start execution beat expensive technology every time.
This should be encouraging for small and mid-size contractors who can’t afford six-figure software deployments. Process discipline is free.
Fleet costs also connect directly to procurement strategy. The parts, fuel, tires, and service contracts that keep a fleet running are all procurement functions. Contractors who treat fleet purchasing as a strategic category, rather than a series of emergency transactions, unlock meaningful savings through supplier discount programs and better vendor relationships.
Common Mistakes Contractors Make
Reactive-only maintenance. Waiting for equipment to break costs 3 to 10 times more than preventing the failure. The $36,400 fault-code story above is typical, not exceptional.
Not tracking utilization. Owning idle assets is one of the fastest ways to destroy margins. Without utilization data, contractors can’t distinguish between equipment they need and equipment that’s just depreciating in a yard.
Treating fleet costs as overhead. When equipment costs sit in a general overhead bucket instead of being allocated to specific projects, contractors lose visibility into which jobs are profitable and which are bleeding money. This has a direct impact on construction cost management.
Running a fragmented tech stack. Multiple disconnected systems for telematics, maintenance, field management, and accounting create data silos. No single person can see the full picture.
Using age as the only replacement trigger. A 12-year-old machine running 300 hours a year may be cheaper to keep than an 8-year-old machine running 1,800 hours a year. Replacement decisions should be driven by TCO data, not calendar age.
How to Start a Fleet Management Program
Starting doesn’t require a massive software investment. It requires commitment to a process.
Inventory every asset. Include owned equipment, rented equipment, vehicles, trailers, and non-powered assets. You can’t manage what you haven’t counted.
Install telematics on your highest-value and most-mobile equipment first. Start with assets over $100,000 or anything that moves between job sites frequently. Expand from there.
Establish PM schedules based on engine hours. Not calendar dates. Not “when it feels like it’s time.” Engine hours.
Track TCO per asset, per project. This means logging fuel, maintenance, insurance, depreciation, and operator costs at the asset level, then allocating those costs to specific jobs. See this guide on purchasing efficiency KPIs for metrics to track.
Set purchasing and replacement guidelines tied to data. Define the utilization threshold below which you rent instead of own. Define the cost-per-hour threshold above which you replace instead of repair. Write these down.
Consolidate vendor relationships. Fleet parts, fuel, and service contracts are procurement categories. Treating them strategically through vendor programs can reduce per-unit costs significantly.
2026 Trends Shaping Contractor Fleet Management
AI-powered predictive maintenance is becoming affordable. Systems that once cost $200,000+ are now available in the $50,000 to $75,000 range, putting them within reach of mid-size contractors. These systems analyze telematics data to predict failures before they happen.
Telematics is the consensus “first investment.” Across industry conversations, telematics consistently comes up as the highest-ROI starting point for contractor fleet management, with payback periods of 60 to 90 days.
ERP integration is a top priority. Contractors want equipment data flowing directly into Vista, Spectrum, Sage, and other construction accounting platforms. The demand for single-platform visibility, regardless of equipment manufacturer or asset class, was a recurring theme at CONEXPO 2026.
Electric equipment is crossing practicality thresholds. Electric skid steers, compact excavators, and wheel loaders are becoming viable for urban projects where noise and emissions restrictions apply. The technology isn’t ready for all applications yet, but the trajectory is clear.
The labor shortage is changing fleet decisions. With 440,000 unfilled operator positions in construction as of 2026, contractors are investing in fleet technologies that reduce dependence on skilled operators or make existing operators more productive.
The construction equipment fleet management market reflects all of this momentum. Valued at $4.6 billion in 2025, it’s projected to reach $12.4 billion by 2032.
Key Contractor Fleet Management Metrics at a Glance
Metric | Value |
|---|---|
Average cost per mile (construction fleet) | $0.23 |
Median TCO per asset | $9,437 |
Fuel as % of operating costs | ~42% |
Ownership break-even utilization | 60-70% |
Downtime cost per asset per day | $2,000 to $10,000 |
First-year cost reduction (with structured management) | 15-25% |
Fleet management software cost | $20 to $60/vehicle/month |
Telematics hardware cost | Less than $200/unit |
Telematics monthly service | $15 to $30/asset |
For contractors ready to reduce fleet-related overhead and improve margins, explore contractor overhead reduction strategies as a next step.
30-Day Contractor Fleet Management Implementation Plan
Week 1: Asset Inventory
List all vehicles and equipment
Record serial numbers
Verify ownership records
Identify high-value assets
Week 2: Tracking and Visibility
Install telematics devices
Establish asset naming conventions
Configure geofences
Week 3: Maintenance Processes
Build preventive maintenance schedules
Assign maintenance responsibilities
Create inspection workflows
Week 4: Cost Tracking and Reporting
Track fuel expenses
Measure utilization
Calculate TCO
Build replacement criteria
By the end of the first month, contractors should have visibility into asset location, utilization, maintenance status, and operating costs.
Frequently Asked Questions
What is the difference between contractor fleet management and regular fleet management?
Regular fleet management typically involves cars, vans, or delivery trucks measured by mileage. Contractor fleet management covers a much broader mix of assets, including heavy equipment, on-road CDL vehicles, and non-powered assets like generators and compressors. Maintenance is tracked by engine hours rather than miles, utilization varies by project and season, and individual asset values can reach $2 million. The regulatory environment is also more complex, with FMCSA requirements for CDL vehicles and OSHA requirements for heavy equipment.
How much does contractor fleet management software cost?
Mid-tier fleet management software typically costs $20 to $60 per vehicle per month. Telematics hardware adds a one-time cost of less than $200 per unit, plus $15 to $30 per month for the monitoring service. Most contractors see a full return on telematics investment within 60 to 90 days.
When should a contractor rent equipment instead of owning it?
The general rule is the 60 to 70% utilization threshold. If a piece of equipment runs at less than 60% utilization, renting is usually cheaper than the combined cost of depreciation, financing, insurance, and maintenance. Above 70%, ownership typically wins. Most contractors benefit from a hybrid model: own core equipment that runs consistently and rent for peak demand or specialty work.
What does equipment downtime actually cost?
Direct downtime costs range from $2,000 to $10,000 per day per asset, depending on the equipment type and project context. But the real cost is often higher when you factor in emergency rental fees, project delay penalties, and the ripple effects on scheduling. One documented case showed a single ignored fault code on a concrete pump costing a contractor $36,400 in total.
How do I calculate total cost of ownership for fleet equipment?
TCO includes acquisition cost (or depreciation), financing, insurance, fuel, maintenance and repairs, operator costs, and disposal value. Track these at the individual asset level and allocate them to specific projects. The most important thing to watch is cost per hour or cost per mile by equipment age, since costs escalate dramatically after year ten.
Do small contractors need fleet management?
Yes, though the approach scales with size. A contractor with 10 pieces of equipment doesn’t need enterprise software, but they absolutely need a PM schedule based on engine hours, basic utilization tracking, and a system for allocating equipment costs to specific jobs. The fundamentals, disciplined processes and good data, matter at every scale.
How does fleet management affect project bidding?
When equipment costs are tracked at the project level rather than lumped into general overhead, contractors can bid more accurately on future work. They know exactly what it costs to run a paver for 400 hours on a parking lot project or operate a concrete pump for a structural pour sequence. This precision prevents both underbidding (which kills margins) and overbidding (which kills win rates).
Recent Comments