
TL;DR
Construction companies spend an average of 3.6% of their budgets on injuries but only 2.6% on safety training, paying more for accidents than prevention. Every $1 invested in safety returns $4 to $8 in reduced costs. This guide covers 10 proven strategies for contractor safety budget optimization, from benchmarking your spend and prioritizing fall protection to bulk PPE procurement and EMR management, so you can cut total project costs without cutting corners on worker protection.
Quick Answer: How Do You Optimize a Contractor Safety Budget?
Contractor safety budget optimization means spending safety dollars where they reduce the greatest amount of financial risk—not simply reducing spending. Most contractors should dedicate approximately 1.5%–3% of project costs to safety while prioritizing fall protection, training, PPE, pre-construction planning, incident prevention, and insurance performance. Companies that optimize safety budgets often reduce injury costs, lower workers’ compensation premiums, improve EMR, and generate an estimated $4–$8 return for every $1 invested in prevention.
Contractor Safety Budget Optimization Checklist
Before changing your safety budget, verify that your company can answer “Yes” to these questions.
Question | Yes / No |
|---|---|
Do we know our safety spending as a percentage of project cost? | |
Do we track near misses? | |
Do we monitor EMR quarterly? | |
Do we review PPE purchasing costs annually? | |
Do we have documented replacement schedules? | |
Do we prioritize fall protection spending? | |
Do we use digital inspections? | |
Do subcontractors meet our safety requirements? | |
Do we measure ROI from safety investments? |
The Real Cost of Getting Safety Spending Wrong
Here’s a number that should change how every contractor thinks about safety: to recover from a single $50,000 injury at a typical 3% profit margin, your company needs to generate $1,667,000 in additional revenue. Safety isn’t overhead. It’s margin protection.
The math gets worse when you zoom out. The National Safety Council reports the average cost of a work injury requiring medical care hit $43,000 in 2023, and total U.S. work-injury costs reached $176.5 billion. OSHA estimates businesses spend at least $97.4 billion annually on occupational injury and illness costs, money that comes straight from company profits.
Yet the construction industry still has its spending ratio backwards. Companies devote 3.6% of budgets to dealing with injuries and only 2.6% to the training that prevents them.
Contractor safety budget optimization isn’t about spending less. It’s about directing every dollar where it generates the most risk reduction, compliance protection, and financial return. The 10 strategies below show exactly how.
Looking for ways to reduce what you pay for safety equipment and PPE in the first place? Explore contractor PPE discount programs to see how group purchasing cuts unit costs before you even start optimizing.
At-a-Glance: Safety Budget Optimization Strategies Compared
Strategy | Primary Saving Mechanism | Estimated Impact | Difficulty |
|---|---|---|---|
Benchmark your safety spend | Right-sizing budget allocation | 1.5–3% of project cost target | Easy |
Calculate the true cost of inaction | Avoiding $43K+ per incident | $4–$8 return per $1 spent | Easy |
Prioritize fall protection | Largest single hazard category | 31% of injuries addressed | Medium |
Train-the-trainer model | Reduced per-employee training cost | $50–$200 saved per head | Medium |
Incident data-driven allocation | Smarter spend, not more spend | Varies by firm | Medium |
Bulk PPE procurement | Volume pricing on recurring costs | 15–30% savings on PPE | Easy |
Safety technology adoption | Automated tracking and prevention | Reduces manual overhead | Medium |
EMR management | Lower insurance premiums | Compounds annually | Hard |
Pre-construction safety planning | Eliminate field-phase rework | 6.5% below-budget performance | Medium |
Trade consolidation | Simpler site safety coordination | Fewer incidents, less overhead | Hard |
Where Should Contractors Spend Their Safety Budget?
Not every safety expense delivers the same return. Contractors should prioritize investments according to both regulatory requirements and financial impact.
Typical Safety Budget Allocation
Budget Category | Suggested Share |
|---|---|
Fall Protection | 20–25% |
PPE | 15–20% |
Safety Training | 15–20% |
Site Inspections | 10–15% |
Technology | 10–15% |
Emergency Equipment | 5–10% |
Compliance Documentation | 5–10% |
Contingency | 5% |
1. Benchmark Your Safety Spend Against Industry Standards
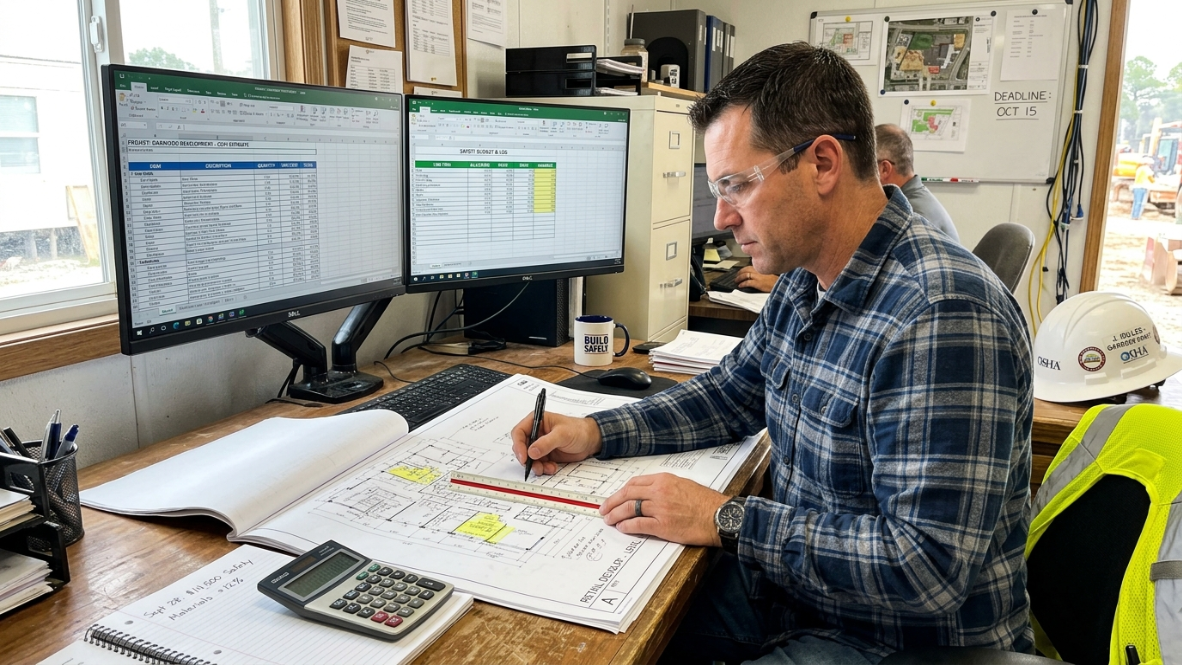
You can’t optimize what you don’t measure. Most contractors have a rough sense of what they spend on safety, but few track it as a precise percentage of each project’s estimated cost.
Industry guidelines recommend dedicating 1.5% to 3% of estimated construction cost to safety, depending on project size and duration. Academic research published in ScienceDirect narrows the floor: the optimal minimum safety investment is 0.672% of the contract amount, with total safety-related costs (accident losses plus safety investment) averaging 1.148% of the total contract value.
The most compelling benchmark comes from the Construction Safety Association of Ontario, which found that firms investing just 2.5% of project costs into safety training and procedures saw profits increase by 4% to 7% per project while accident rates decreased.
The tactic: Create a safety budget line item as a fixed percentage of every project estimate. Make it non-negotiable during bid preparation. If your current spend is below 1.5%, you’re almost certainly paying more in incidents than you would in prevention.
For broader context on aligning safety spend within your overall project financials, see this guide on construction cost optimization strategies.
2. Calculate the True Cost of NOT Spending
Every safety dollar you cut adds $4 to $8 in downstream costs. The American Society of Safety Engineers found that for every dollar spent on a quality safety program, businesses saved $8. Even conservative estimates from OSHA put the return at $4 to $6 per dollar.
These returns come from avoiding costs that are bigger than most project managers realize:
Direct injury costs: The average work injury requiring medical consultation costs $43,000. Workers’ compensation for disabling, nonfatal injuries exceeds $1 billion per week nationally.
OSHA penalties: Since January 2024, serious violations carry fines up to $16,131 each. Willful or repeated violations can reach $161,323 per infraction.
Indirect costs: Lost productivity, employee replacement, and management distraction often double the direct amount. As one practitioner quoted in an OpenSpace data report put it: “Workers’ comp gets filed and everyone moves on. What doesn’t get counted is the superintendent who spent two days dealing with the incident instead of running the job. The subcontractor who had to pull their best guy off a critical path activity to cover.”
The tactic: Use OSHA’s free Safety Pays Estimator to model your actual exposure. Present leadership with the specific dollar amount your company risks per unaddressed hazard. When the conversation shifts from “safety costs money” to “incidents cost more money,” budget approval gets easier.
For a deeper look at managing these costs, review these cost management strategies and tools.
Example: The ROI of Preventing One Injury
Assume a contractor spends $12,000 improving fall protection and training.
Item | Amount |
|---|---|
Safety Investment | $12,000 |
Injury Avoided | $43,000 |
Indirect Costs Avoided | $35,000 |
OSHA Fine Avoided | $16,131 |
Total Savings | $94,131 |
Net Return | $82,131 |
This simple example demonstrates why prevention usually costs far less than responding to an incident.
3. Prioritize Fall Protection and the “Fatal Four”
If you only have budget for one safety investment, spend it on fall protection. Falls account for roughly 31% of construction injuries and 47% of fatal incidents. Fall protection has held the number one position on OSHA’s most-cited violations list for 14 consecutive years, with 6,307 citations in fiscal year 2024 and 5,914 in fiscal year 2025.
The “Fatal Four” (falls, struck-by, electrocution, caught-in/between) collectively account for the majority of construction fatalities. Concentrating your safety budget optimization efforts on these categories, particularly falls, addresses the largest cluster of risk with the fewest line items.
The tactic: Audit all fall protection equipment annually. Replace harnesses, lanyards, and anchor points before failure, not after. Budget for replacement on a fixed schedule rather than waiting for visible damage. The cost of a new harness is trivial compared to a single fall-related claim.
Make sure your team has the right gear in the first place. This jobsite safety equipment checklist covers OSHA requirements across all major hazard categories.
4. Adopt a Train-the-Trainer Model
External safety training sessions led by certified professionals cost between $50 and $200 per employee depending on complexity. For a crew of 40, that’s $2,000 to $8,000 per training cycle, and OSHA 10-Hour and 30-Hour courses, first aid/CPR certifications, and hazard-specific modules need regular refreshing.
A train-the-trainer approach amortizes that cost dramatically. You send two or three people to earn instructor certifications, then those individuals deliver training in-house across every crew and project. The upfront investment is higher per person, but the per-employee cost drops to nearly zero after the first cycle.
The tactic: Certify 2 to 3 in-house trainers per office or region. Rotate them across jobsites to cover all crews. Prioritize OSHA 10/30-Hour, fall protection competent person, and first aid/CPR instructor certifications first, as these cover the broadest range of compliance requirements.
Practitioners on construction forums frequently note that in-house trainers also deliver better results because they know the specific hazards on your projects, not just textbook scenarios.
5. Use Incident Data to Drive Resource Allocation
Spreading safety dollars evenly across all hazard categories feels fair. It’s also wasteful. Your own incident and near-miss data tells you exactly where the highest risk concentrations sit, and that’s where each marginal dollar delivers the most protection.
The key distinction: lagging indicators (recordable injuries, lost-time incidents) tell you what already went wrong. Leading indicators (near-misses, inspection findings, safety observation reports) tell you what’s about to go wrong. Shifting your attention toward leading indicators lets you catch problems before they become line items on an insurance claim.
One practical approach recommended across safety management circles: ask frontline workers directly. They encounter hazards daily and often know where the real risks are before any manager does. Running a simple safety survey once or twice a year, even just a printed form, produces written documentation that supports budget requests when safety spend needs justification.
The tactic: Track near-misses systematically. Categorize them by hazard type, trade, and project. At year-end, allocate next year’s safety budget proportionally to where near-misses clustered. This approach makes contractor safety budget optimization data-driven rather than assumption-driven.
For the broader cost control framework, read more about contractor cost control strategies.
Safety Metrics Every Contractor Should Monitor
Budget optimization is impossible without measurable performance.
Track these KPIs monthly.
KPI | Why It Matters |
|---|---|
EMR | Insurance costs |
TRIR | OSHA benchmark |
DART Rate | Lost productivity |
Near Miss Reports | Leading indicator |
PPE Compliance | Daily risk reduction |
Toolbox Talk Attendance | Training effectiveness |
Safety Audit Scores | Continuous improvement |
Corrective Actions Closed | Accountability |
6. Negotiate Bulk PPE and Equipment Through Group Purchasing
Personal protective equipment is a recurring cost that most contractors manage poorly. Buying hard hats, safety glasses, gloves, high-vis vests, and fall protection gear from local distributors in small quantities leaves 15% to 30% of potential savings on the table.
Brand-name safety glasses run $10 to $15 per pair at retail. Equivalent alternatives meeting the same ANSI standards exist at $3 to $5 per pair. Multiply that gap across hundreds of workers and dozens of reorders per year, and the waste is significant.
Group purchasing organizations and buyer alliances negotiate volume pricing that individual contractors can’t access alone. The savings apply not just to PPE but to first-aid supplies, signage, fire extinguishers, and fall protection hardware, essentially every recurring safety line item.
Ready to cut your PPE costs without switching to lower quality? See how contractor supplier discount programs work and what savings are realistically achievable.
The tactic: Join a buying alliance or group purchasing program. Lock in volume pricing across your most common PPE categories. Consolidate orders to trigger volume breaks. Even a 20% reduction on PPE across a mid-size contractor’s annual spend frees up thousands for higher-impact safety investments like training or technology.
For a broader comparison of vendor options, this construction safety supply vendors comparison breaks down what’s available.
Common Safety Budget Mistakes
Many contractors unknowingly waste thousands of dollars by making avoidable budgeting mistakes.
Common examples include:
Buying PPE in small quantities
Waiting until equipment fails before replacement
Cutting training during slow periods
Ignoring near-miss reporting
Focusing only on OSHA compliance instead of prevention
Treating safety as overhead instead of risk management
Failing to review insurance claims annually
7. Invest in Safety Technology for Long-Term Savings
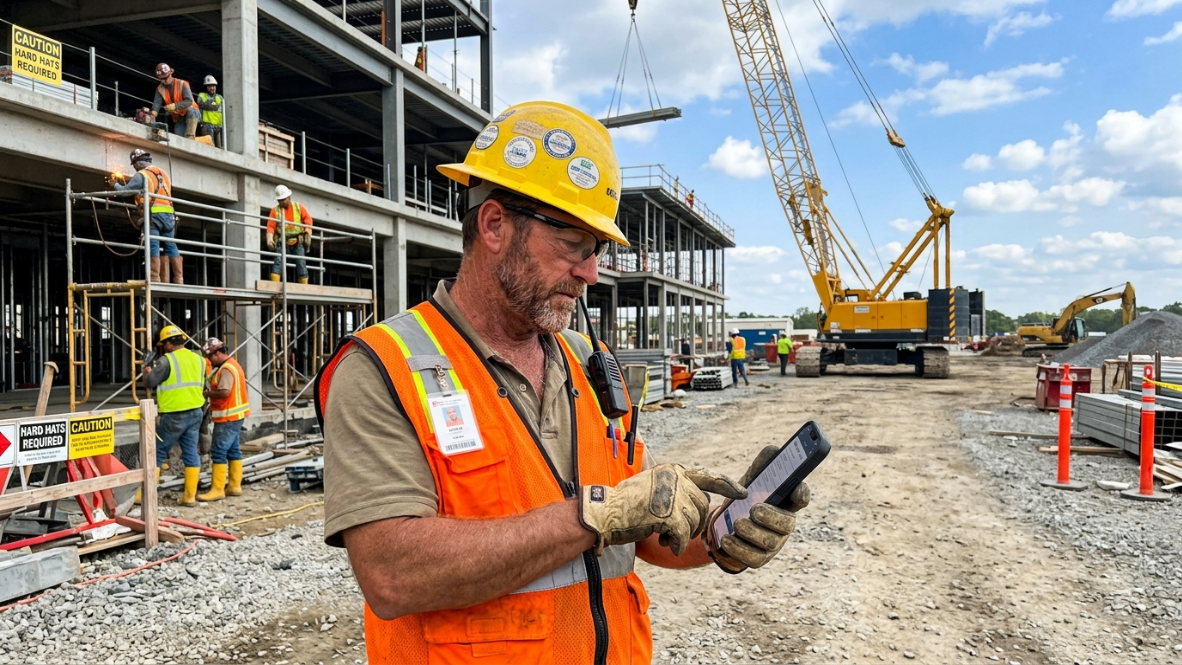
Digital tools replace costly manual processes and catch problems earlier. The simplest starting point, digital inspection checklists and incident reporting apps, requires minimal investment but produces immediate returns through faster hazard identification and automatic documentation.
Manual safety tracking doesn’t scale. When a contractor runs three jobsites, a clipboard and spreadsheet might work. At ten sites across multiple states, gaps appear. Inspections get missed. Near-misses go unreported. Trends that would be obvious in a dashboard remain invisible in paper files.
Safety software collects real-time data and automates processes for a fixed monthly cost, turning variable risk into a predictable expense. More advanced options include wearable sensors that detect heat stress or fatigue, AI-powered camera systems that flag PPE non-compliance, and real-time location tracking for lone workers.
The tactic: Start with the lowest-cost, highest-impact tools: digital inspection checklists and mobile incident reporting. These typically cost $5 to $20 per user per month and eliminate the most common failure mode in safety programs, which is simply not knowing what’s happening on the ground.
For more on building operational efficiency through technology, see these proven operational efficiency strategies.
Best Safety Technology Investments by Contractor Size
Company Size | Recommended Technology |
|---|---|
Under 20 employees | Digital inspection apps |
20–75 employees | Incident reporting software |
75–200 employees | Safety management platform |
200+ employees | AI monitoring, wearables, predictive analytics |
8. Manage Your EMR to Lower Insurance Premiums
Your Experience Modification Rate directly controls your workers’ compensation premium. An EMR of 1.0 means your injury experience matches the industry average. Below 1.0 means you’re safer than average and your premiums reflect it. Above 1.0 means you’re paying a surcharge.
Contractors with an EMR above 1.25 often face corrective action requirements from their insurers and may be disqualified from bidding on projects that set EMR thresholds. The financial impact compounds: a poor EMR inflates premiums for three years based on NCCI’s rolling calculation window.
This is one of the most overlooked aspects of contractor safety budget optimization. Every incident that becomes a claim raises your EMR, which raises your premiums, which eats into your margins on every future project. Preventing just three recordable incidents among your crews avoids roughly $129,000 in direct costs, likely more than an entire year’s safety spend.
The tactic: Track your EMR quarterly, not annually. Assign every incident a documented corrective action within 48 hours. Work with your insurance broker to understand exactly which claims are driving your modifier. Set a concrete goal: keep EMR below 1.0, and tie safety bonuses to it.
Managing your EMR is also an overhead reduction strategy since insurance premiums are one of the largest fixed costs for any contractor.
How EMR Improvements Save Money Over Time
Improving your EMR creates compounding financial benefits because workers’ compensation premiums reflect multiple years of claims history.
For example:
EMR | Premium Impact |
|---|---|
0.75 | Significant discount |
0.90 | Moderate discount |
1.00 | Standard premium |
1.10 | Increased premium |
1.25+ | Possible bid disqualification |
9. Build Safety Into Pre-Construction Planning
The cheapest time to solve a safety problem is before anyone sets foot on site. Post-mobilization changes, whether it’s adding fall protection that wasn’t planned, rerouting traffic control, or addressing a soil condition that creates trench hazards, cost exponentially more than addressing them during planning.
Research shows that projects with well-aligned early-stage teams deliver cost performance 6.5% below budget. Poor early communication leads to 3.3% overspend plus 24.5% schedule delays. Safety planning is a major driver of that alignment.
One best practice highlighted across safety management resources: treat safety history as a pass/fail gate during bid review, not a tiebreaker you weigh against price. If a subcontractor’s EMR is above your threshold, they don’t make the shortlist regardless of their number.
The tactic: Include a dedicated safety section in every pre-construction scope meeting. Identify site-specific hazards (overhead power lines, adjacent traffic, unstable soils, confined spaces) before crews arrive. Require subcontractors to submit site-specific safety plans as a condition of contract award.
For a comprehensive pre-construction checklist, review this procurement planning checklist guide.
10. Consolidate Trades to Reduce Multi-Contractor Safety Complexity
Every additional subcontractor on a jobsite adds coordination risk. Different companies bring different safety cultures, different training standards, and different equipment conditions. Managing safety across five subcontractors is dramatically more complex than managing it across two.
With 92% of construction firms reporting hiring difficulties, many general contractors are stacking more subcontractor tiers to fill gaps. More layers mean more interfaces where communication breaks down, more opportunities for one crew’s work to create hazards for another, and more safety orientations to conduct.
Where possible, using multi-trade contractors who self-perform across scopes reduces this complexity. One safety program, one set of standards, one crew culture. The safety management overhead drops, and so does the likelihood of inter-trade incidents.
The tactic: During procurement, evaluate whether a single multi-trade contractor can cover scopes that you’d otherwise split across three or four subs. The hourly rate might be slightly higher, but the total cost, including safety coordination, often comes out lower.
For guidance on evaluating and onboarding vendors effectively, this construction vendor onboarding guide walks through the process.
Putting It All Together
Contractor safety budget optimization works when you stop treating safety as a cost to minimize and start treating it as an investment to optimize. The data is unambiguous: every $1 in safety returns $4 to $8 in reduced injury costs, lower insurance premiums, fewer OSHA penalties, and less project disruption.
The strategies above aren’t theoretical. Benchmark your spend. Calculate your true exposure. Focus on the hazards that actually hurt your people. Train smarter. Buy smarter. Track the numbers that matter.
Stopping just three recordable incidents saves roughly $129,000, more than most contractors spend on safety in a year. That’s not a cost center. That’s one of the highest-ROI line items in your entire budget.
Want to start saving on the equipment side immediately? See how construction procurement savings programs help contractors reduce what they spend on PPE, materials, and supplies so more of the budget goes toward the safety investments that actually prevent incidents.
Frequently Asked Questions
What percentage of a construction budget should go to safety?
Industry guidelines recommend 1.5% to 3% of estimated construction cost, depending on project size and complexity. Academic research sets the minimum effective investment at 0.672% of the contract amount. The Construction Safety Association of Ontario found that firms investing 2.5% saw profits increase by 4% to 7% per project.
What is the ROI of investing in construction safety?
Conservative estimates from OSHA show $4 to $6 returned for every $1 spent on workplace safety. The American Society of Safety Engineers puts the return even higher at $8 per dollar. Returns come from reduced workers’ compensation claims, lower insurance premiums, fewer OSHA fines, and less project disruption.
How much does a typical construction workplace injury cost?
The National Safety Council reports the average cost of a work injury requiring medical care was $43,000 in 2023. Indirect costs (lost productivity, management time, employee replacement) often double the direct amount. At a 3% profit margin, recovering from a single $50,000 loss requires $1.67 million in new revenue.
What are the current OSHA penalty amounts for construction violations?
As of January 2024, serious and other-than-serious violations carry fines up to $16,131 per violation. Willful or repeated violations can cost up to $161,323 per infraction. These amounts are adjusted annually for inflation.
How does EMR affect my construction safety budget?
Your Experience Modification Rate directly controls workers’ compensation premiums. An EMR above 1.0 means you’re paying a surcharge on every project. An EMR above 1.25 can disqualify you from bids. Because the calculation uses a three-year rolling window, every incident inflates costs for years. Managing your EMR is one of the most effective long-term contractor safety budget optimization strategies.
What is the most common OSHA violation in construction?
Fall protection has been the number one cited OSHA violation for 14 consecutive years, with thousands of citations issued annually. Falls account for approximately 31% of construction injuries and 47% of fatal incidents, making fall protection the single highest-priority safety investment for any contractor.
How can small contractors afford safety technology?
Start with the lowest-cost tools: digital inspection checklists and mobile incident reporting apps, which typically run $5 to $20 per user per month. These replace paper-based tracking, catch hazards faster, and create documentation automatically. Scale up to more advanced technology (wearables, AI cameras) only after you’ve established consistent digital reporting habits.
Is it cheaper to do safety training in-house or hire external trainers?
External training costs $50 to $200 per employee per session. A train-the-trainer model has higher upfront cost per person but amortizes rapidly. After certifying 2 to 3 in-house instructors, per-employee training costs approach zero for subsequent sessions. In-house trainers also deliver more relevant content because they know your specific jobsite hazards.
Recent Comments